Analyzing performance using the graph data
In this section:
The Timeline window provides a set of tools for analyzing the graph data.
Execute your application to display a graph, following the steps described in Displaying a graph in the Timeline window.
Whenever execution stops, point at the graph with the mouse pointer to get detailed tooltip information for that location.
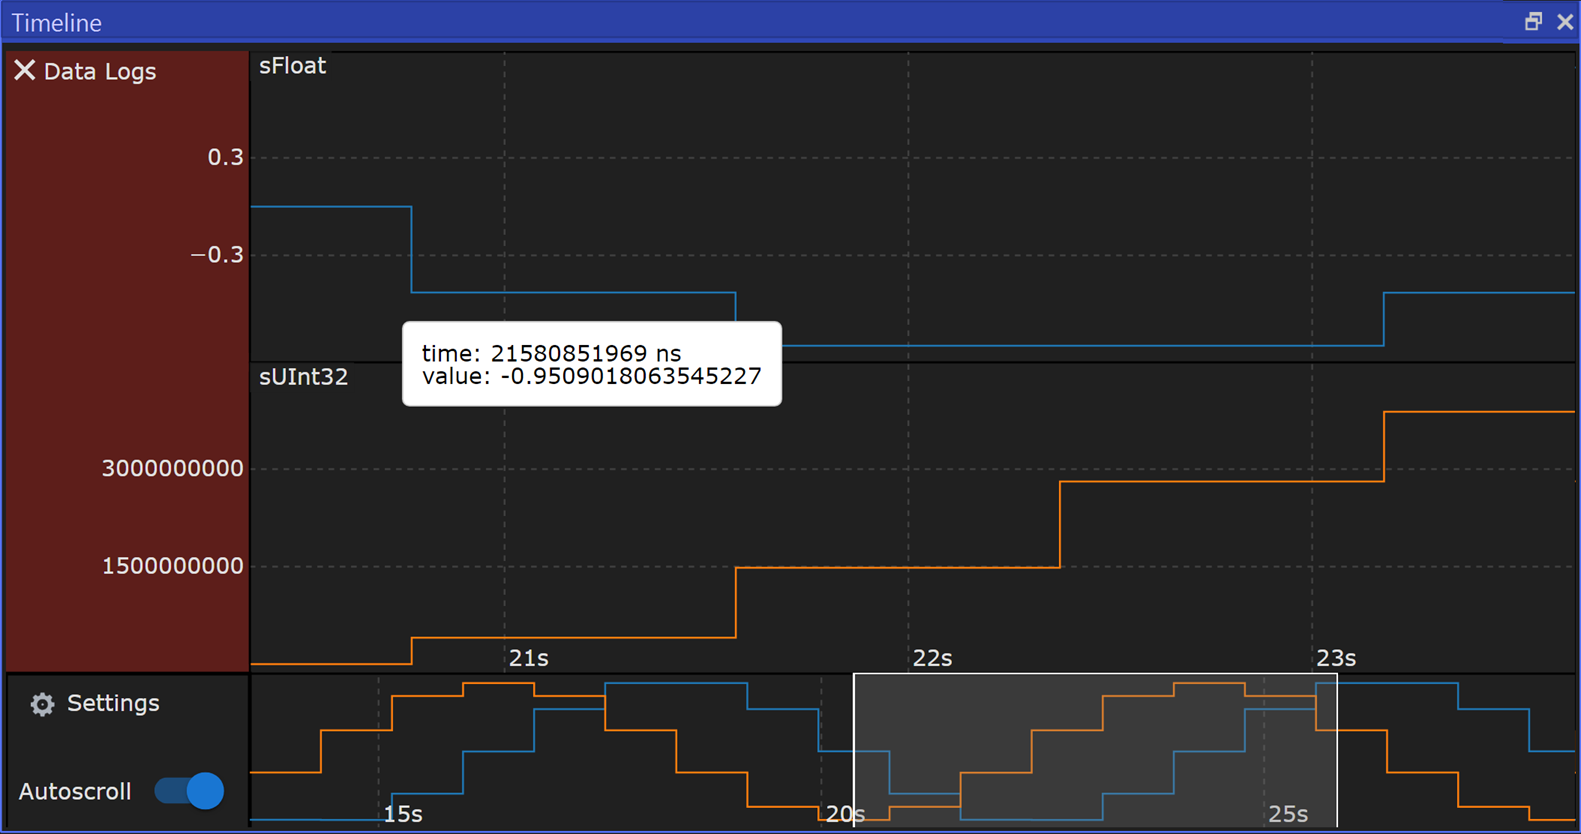
Note that if you have enabled several graphs, you can move the mouse pointer over the different graphs to get graph-specific information. Open the Settings context menu and choose Zoom In in y if there is no translucent zoom box on the y axis. Enlarge and reduce it by holding down Ctrl and using the scroll wheel, to see the graph in better detail.