Call Graph window
What do you want to do?
Learn how to: Finding function calls for a selected function
Get reference information about the Call Graph window, see below the line.

The Call Graph window is available from the context menu in the editor and Outline windows.
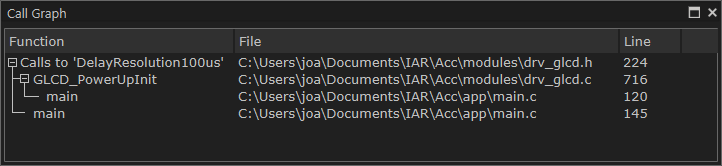
This window displays calls to or calls from a function. The window is useful for navigating between the function calls.
To display a call graph, select a function name in the editor window or in the Outline window, right-click and select Find All Calls to from the context menu.
Double-click an entry in the window to place the insertion point at the location of the function call (or definition, if a call is not applicable for the entry). The editor will open the file that contains the call if necessary.
Context menu
This context menu is available:
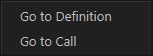
These commands are available:
- Go to Definition
Places the insertion point at the location of the function definition.
- Go to Call
Places the insertion point at the location of the function call.