- IAR Embedded Workbench for Arm 10.10.x
- IDE Project Management and Building
- The development environment
- Reference information on the IDE
- IAR Embedded Workbench IDE window
IAR Embedded Workbench IDE window
What do you want to do?
Learn about the IDE, see Introduction to the IAR Embedded Workbench IDE
Learn how to: Using and customizing the IDE
Get reference information on the IDE main window, see below the line.

The main window of the IDE is displayed when you launch the IDE.

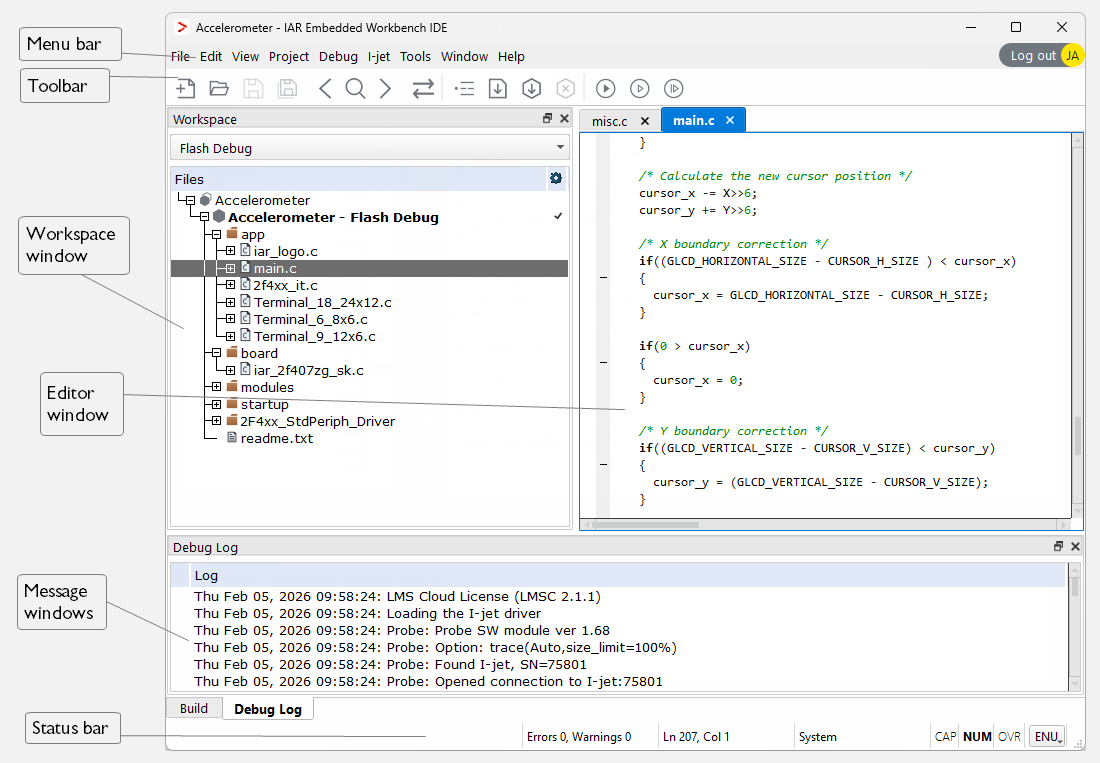
The figure shows the window and its default layout.
Menu bar
The menu bar contains:
- File
Commands for opening source and project files, saving and printing, and exiting from the IDE.
- Edit
Commands for editing and searching in editor windows and for enabling and disabling breakpoints in C-SPY.
- View
Commands for opening windows and controlling which toolbars to display.
- Project
Commands for adding files to a project, creating groups, and running the IAR tools on the current project.
- Debug
Commands for debugging the current project and downloading your application to the target device.
- Simulator
Commands specific for the C-SPY simulator. This menu is only available when you have selected the simulator driver in the Options dialog box.
- C-SPY hardware driver
Commands specific for the C-SPY hardware debugger driver you are using, in other words, the C-SPY driver that you have selected in the Options dialog box. For some IAR Embedded Workbench products, the name of the menu reflects the name of the C-SPY driver you are using and for others, the name of the menu is Emulator.
- Tools
User-configurable menu to which you can add tools for use with the IDE.
- Window
Commands for manipulating the IDE windows and changing their arrangement on the screen.
- Help
Commands that provide help about the IDE.
For more information about each menu, see Menus.
Toolbar
The buttons on the IDE toolbar provide shortcuts for the most useful commands on the IDE menus, and a text box for typing a string to do a quick search. For information about how to add and remove commands on the toolbars, see Using and customizing the IDE.
For a description of any command, point to it with the mouse pointer. When a command is not available, the corresponding toolbar button is dimmed, and you will not be able to click it.
The toolbars are dockable—drag and drop to rearrange them.
Note
When you start C-SPY, the Download and Debug button will change to a Make and Restart Debugger button, and the Debug without Downloading will change to a Restart Debugger button.
Log in
If you have a cloud license for IAR Embedded Workbench for Arm, there is a button in the top right corner of the main IDE window. When you are logged out from your IAR account, the button reads Log in. If you are logged in, it displays your signature.

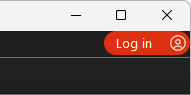
Clicking Log in opens a web page in your default web browser, for logging in to your IAR account. For more information, see the licensing documentation. When you are logged in, clicking the button displays a menu for logging out.
Status bar
The status bar at the bottom of the window can be enabled from the View menu.

The status bar displays:
Status messages
Build progress bar
The number of errors and warnings generated during a build
The position of the insertion point in the editor window. When you edit, the status bar shows the current line and column number containing the insertion point.
The character encoding
The state of the modifier keys Caps Lock, Num Lock, and Overwrite.
If your product package is available in more languages than English, a three-letter label in the corner shows the language version you are using. Click to change the language. The change will take force the next time you launch the IDE.