Breakpoints options
The Breakpoints options page is available in the Options dialog box. Choose Project>Options, select the category specific to the debugger system you are using, and click the Breakpoints tab.
Use this dialog box to set driver-specific breakpoint options.
Requirements
One of these alternatives:
The C-SPY CMSIS-DAP driver
The C-SPY GDB Server driver
The C-SPY I-jet driver
The C-SPY J-Link/J-Trace driver
The C-SPY ST-LINK driver
The C-SPY TI XDS driver
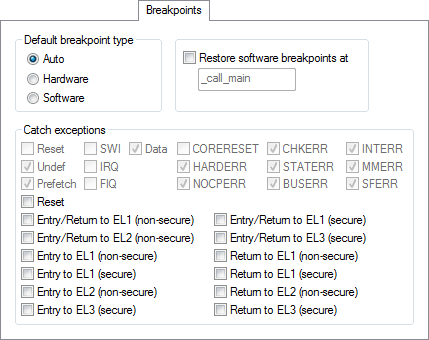
Default breakpoint type
Selects the type of breakpoint resource to be used when setting a breakpoint. Choose between:
Auto | Uses a software breakpoint. If this is not possible, a hardware breakpoint will be used. The debugger will use read/write sequences to test for RAM; in that case, a software breakpoint will be used. The Auto option works for most applications. However, there are cases when the performed read/write sequence will make the flash memory malfunction. In that case, use the Hardware option. |
Hardware | Uses hardware breakpoints. If it is not possible, no breakpoint will be set. |
Software | Uses software breakpoints. If it is not possible, no breakpoint will be set. |
Restore software breakpoints at
Restores software breakpoints that were overwritten during system startup.
This can be useful if you have an application that is copied to RAM during startup and is then executing in RAM. This can, for example, be the case if you use the initialize by copy linker directive for code in the linker configuration file or if you have any __ramfunc declared functions in your application.
In this case, all breakpoints will be destroyed during the RAM copying when the C-SPY debugger starts. By using the Restore software breakpoints at option, C-SPY will restore the destroyed breakpoints.
Use the text field to specify the location in your application at which point you want C-SPY to restore the breakpoints. The default location is the label _call_main.
Catch exceptions
Sets a breakpoint directly on a vector in the interrupt vector table, without using a hardware breakpoint. This option is available for Arm9/10/11 and all Cortex devices. The settings you make will work as default settings for the project. However, you can override these default settings during the debug session by using the Vector Catch dialog box, see Setting a breakpoint on an exception vector.
The settings you make will be preserved during debug sessions.
This option is supported by the C-SPY I-jet driver and the C-SPY J-Link/J-Trace driver.