Interrupt Log window
What do you want to do?
Learn about:
Learn how to:
Get related information:
Get reference information about the Interrupt Log window, see below the line.

The Interrupt Log window is available from the C-SPY driver menu.

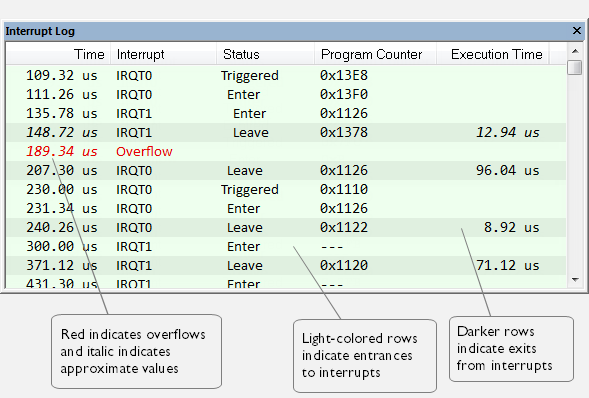
This window logs entrances to and exits from interrupts. The C-SPY Simulator also logs internal state changes.
The information is useful for debugging the interrupt handling in the target system. When the Interrupt Log window is open, it is updated continuously at runtime.
Note
There is a limit on the number of saved logs. When this limit is exceeded, the oldest entries in the buffer are erased.
For more information, see Getting started using interrupt logging.
Requirements
One of these alternatives:
The C-SPY simulator. Not available for all cores and devices.
An I-jet or I-jet Trace in-circuit debugging probe, and an SWD interface between the debug probe and the target system
A J-Link or J-Trace debug probe with an SWD interface between the debug probe and the target system
An ST-LINK debug probe with an SWD interface between the debug probe and the target system
A TI XDS debug probe and an SWD interface between the debug probe and the target system
Display area for the C-SPY hardware debugger drivers
This area contains these columns:
- Time
The time for the interrupt entrance, based on the CPU clock frequency specified in the SWO Configuration dialog box.
If a time is displayed in italics, the target system has not been able to collect a correct time, but instead had to approximate it.
This column is available when you have selected Show Time from the context menu. If the Show Time command is not available, the Time column is displayed by default.
- Cycles
The number of cycles from the start of the execution until the event.
A cycle count displayed in italics indicates an approximate value. Italics is used when the target system has not been able to collect a correct value, but instead had to approximate it.
This column is available when you have selected Show Cycles from the context menu provided that the C-SPY driver you are using supports it.
- Interrupt
The name of the interrupt source where the interrupt occurred. If the column displays Overflow in red, the communication channel failed to transmit all interrupt logs from the target system.
- Status
The event status of the interrupt:
Enter, the interrupt is currently executing.
Leave, the interrupt has finished executing.
- Program Counter*
The address of the interrupt handler.
- Execution Time/Cycles
The time spent in the interrupt, calculated using the Enter and Leave timestamps. This includes time spent in any subroutines or other interrupts that occurred in the specific interrupt.
* You can double-click an address. If it is available in the source code, the editor window displays the corresponding source code, for example for the interrupt handler (this does not include library source code).
Display area for the C-SPY simulator
This area contains these columns:
- Time
The time for the interrupt entrance, based on an internally specified clock frequency.
This column is available when you have selected Show Time from the context menu.
- Cycles
The number of cycles from the start of the execution until the event.
This column is available when you have selected Show Cycles from the context menu.
- Interrupt
The interrupt as defined in the device description file.
- Status
Shows the event status of the interrupt:
Triggered, the interrupt has passed its activation time.
Forced, the same as Triggered, but the interrupt was forced from the Available Interrupts window.
Enter, the interrupt is currently executing.
Leave, the interrupt has been executed.
Expired, the interrupt hold time has expired without the interrupt being executed.
Rejected, the interrupt has been rejected because the necessary interrupt registers were not set up to accept the interrupt.
- Program Counter
The value of the program counter when the event occurred.
- Execution Time/Cycles
The time spent in the interrupt, calculated using the Enter and Leave timestamps. This includes time spent in any subroutines or other interrupts that occurred in the specific interrupt.
Context menu
This context menu is available:

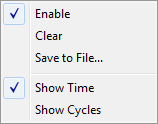
These commands are available:
- Enable
Enables the logging system. The system will log information also when the window is closed.
- Clear
Deletes the log information. Note that this will also happen when you reset the debugger.
- Save to File
Displays a standard file selection dialog box where you can select the destination file for the log information. The entries in the log file are separated by
TABandLFcharacters. An X in the Approx column indicates that the timestamp is an approximation.
- Show Time
Displays the Time column. If the Time column is displayed by default in the C-SPY driver you are using, this menu command is not available.
- Show Cycles
Displays the Cycles column. If the Cycles column is not supported in the C-SPY driver you are using, this menu command is not available.