Selecting a time interval for profiling information
Normally, the profiler computes its information from all PC samples it receives, accumulating more and more information until you explicitly clear the profiling information. However, you can choose a time interval for which the profiler computes the PC samples. This function is supported by the I-jet and I-jet Trace in-circuit debugging probes, the J-Link probe, the J-Trace probe, the ST-LINK probe, and the TI XDS probe.
Choose Function Profiler from the C-SPY driver menu.
In the Function Profiler window, right-click and choose Source: Sampling from the context menu.
Execute your application to collect samples.
Choose Driver>Timeline.
In the Timeline window, click and drag to select a time interval.
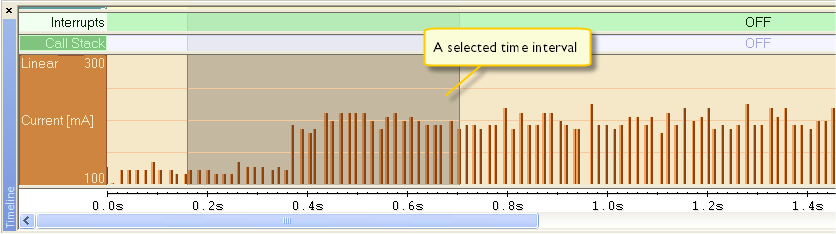
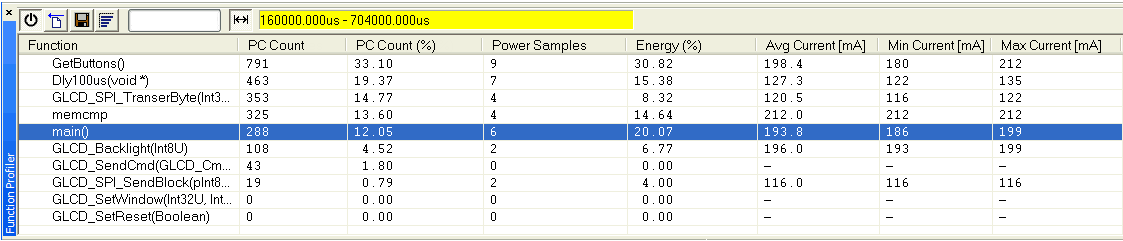
In the selected time interval, right-click and choose Profile Selection from the context menu.
The Function Profiler window now displays profiling information for the selected time interval.
Click
 the Full/Time-interval profiling button to toggle the Full profiling view.