Event Log window
What do you want to do?
Learn about:
Learn how to:
Get reference information about the Event Log window, see below the line.

The Event Log window is available from the C-SPY driver menu.
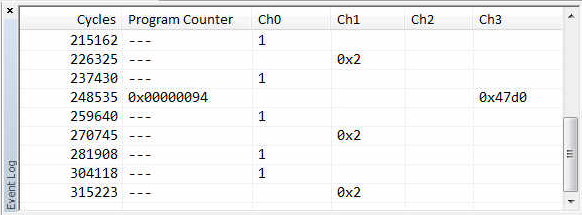
This window displays the events produced when the execution passes specific positions in your application code. The Cortex ITM communication channels are used for passing the events from a running application to the C-SPY Events system.
Note
There is a limit on the number of saved logs. When this limit is exceeded, the oldest entries in the buffer are erased.
Context menu
This context menu is available:
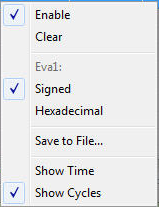
These commands are available:
- Enable
Enables the logging system. The system will log information also when the window is closed.
- Clear
Deletes the log information. Note that this will also happen when you reset the debugger.
- Variable
The name of the channel for which the Events-specific commands below apply. This menu command is context-sensitive, which means it reflects the channel in the Events graph you selected in the Timeline window (one of up to four).
- Signed
Toggles between displaying the selected value as a signed or unsigned number. Note that this setting also affects the log window.
- Hexadecimal
Toggles between displaying the selected value in decimal or hexadecimal format. Note that this setting also affects the log window.
- Save to File
Displays a standard file selection dialog box where you can select the destination file for the log information. The entries in the log file are separated by
TABandLFcharacters. An X in the Approx column indicates that the timestamp is an approximation.
- Show Time
Displays the Time column. If the Time column is displayed by default in the C-SPY driver you are using, this menu command is not available.
- Show Cycles
Displays the Cycles column. If the Cycles column is not supported in the C-SPY driver you are using, this menu command is not available.