Debugger options
What do you want to do?
Learn about the C-SPY debugger, see the debugger documentation.
Get reference information about the Debugger tool options, see below the line.

The Debugger options are available by choosing Tools>Options.

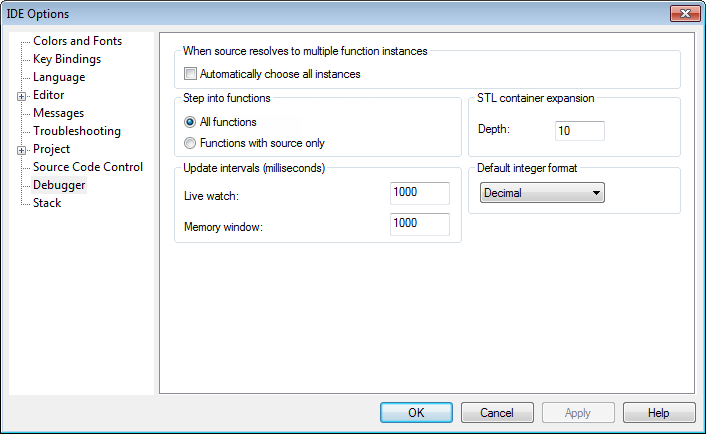
Use this page to configure the debugger environment.
When source resolves to multiple function instances
Some source code corresponds to multiple code instances, for example template code. When specifying a source location in such code, for example when setting a source breakpoint, you can make C-SPY act on all instances or a subset of instances. Use the Automatically choose all instances option to let C-SPY act on all instances without asking first.
Step into functions
Controls the behavior of the Step Into command. Choose between:
- All functions
Makes the debugger step into all functions.
- Functions with source only
Makes the debugger step only into functions for which the source code is known. This helps you avoid stepping into library functions or entering disassembly mode debugging.
STL container expansion
Specify how many elements are shown initially when a container value is expanded in, for example, the Watch window.
Update intervals
Specify how often the contents of the Live Watch window and the Memory window are updated in milliseconds.
These text boxes are only available if the C-SPY driver you are using has access to the target system memory while executing your application.
Default integer format
Selects the default integer format in the Watch, Locals, and related windows.