[タイムライン]ウィンドウのステートロググラフ
What do you want to do?
Learn about:
Learn how to:
Get related information:
タイムラインウィンドウに関する参照情報については、下記をご参照ください。

[タイムライン]ウィンドウのステートロググラフは、デバッグセッション中C-SPY ドライバメニューから使用できます。
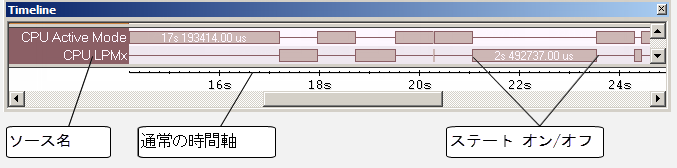
[ステートログ]グラフには、共通の時間軸に関連したペリフェラル、クロック、および CPU モードの記録されたアクティビティステート変更がグラフィック表示されます。
表示エリア
場所:
グラフ左端のラベルエリアには、ステータス情報のソース名が表示されます。
グラフには、デバッグプローブまたは関連のハードウェアで生成されたペリフェラル、クロック、CPUモードの状態が表示されます。白い数字にはステートで費やした時間が示されます。このグラフは[ステートログ]ウィンドウの情報をグラフィック表示したものです(ステートログウィンドウ参照)。
ウィンドウの下部分に、秒を時間単位として使用する共有の時間軸があります。
Context menu
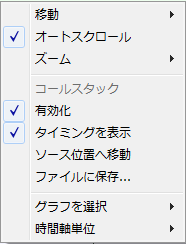
This context menu is available:
注記
The context menu contains some commands that are common to all graphs in the Timeline window and some commands that are specific to each graph.
These commands are available:
- Navigate
Commands for navigating the graph(s). Choose between:
Next moves the selection to the next relevant point in the graph. Shortcut key: right arrow.
Previous moves the selection backward to the previous relevant point in the graph. Shortcut key: left arrow.
First moves the selection to the first data entry in the graph. Shortcut key: Home.
Last moves the selection to the last data entry in the graph. Shortcut key: End.
End moves the selection to the last data in any displayed graph, in other words the end of the time axis. Shortcut key: Ctrl+End.
- Auto Scroll
Toggles automatic scrolling on or off. When on, the most recently collected data is automatically displayed when you choose Navigate>End.
- Zoom
Commands for zooming the windowウィンドウ, in other words, changing the time scale. Choose between:
Zoom to Selection makes the current selection fit the windowウィンドウ. Shortcut key: Return.
Zoom In zooms in on the time scale. Shortcut key: +
Zoom Out zooms out on the time scale. Shortcut key: –
10ns, 100ns, 1us, etc makes an interval of 10 nanoseconds, 100 nanoseconds, 1 microsecond, respectively, fit the windowウィンドウ.
1ms, 10ms, etc makes an interval of 1 millisecond or 10 milliseconds, respectively, fit the windowウィンドウ.
10m, 1h, etc makes an interval of 10 minutes or 1 hour, respectively, fit the windowウィンドウ.
- Power Log
A heading that shows that the Power Log-specific commands below are available.
- Enable
Toggles the display of the graph on or off. If you disable a graph, that graph will be indicated as OFF in the windowウィンドウ. If no data has been collected for a graph, no data will appear instead of the graph.
- Viewing Range
Displays a dialog box, see [表示範囲]ダイアログボックス.
- Size
Determines the vertical size of the graph—choose between Small, Medium, and Large.
- Style
Selects the style of the graph. Choose between:
Bars, displays a vertical bar for each log.
Columns, displays a column for each log.
Levels, displays the graph with a rectangle for each log, optionally color-filled.
Linear, displays the graph as a thin line between consecutive logs.
Note that all styles are not available for all graphs.
- Show Numerical Value
Shows the numerical value of the variable, in addition to the graph.
- Go To Source
Displays the corresponding source code in an editor windowウィンドウ, if applicable.
- Open Setup Window
Opens the Power Log Setup window.
- Select Graphs
Selects which graphs to be displayed in the Timeline windowウィンドウ.
- Time Axis Unit
Selects the unit used in the time axis—choose between Seconds and Cycles.
If Cycles is not available, the graphs are based on different clock sources. In that case you can view cycle values as tooltip information by pointing at the graph with your mouse pointer.
- Profile Selection
Enables profiling time intervals in the Function Profiler windowウィンドウ. Note that this command is only available if the C-SPY driver supports PC Sampling. See プロファイリング情報の間隔を選択する.