Performance Analysis window
The Performance Analysis window is available from the C-SPY driver menu during a debug session.
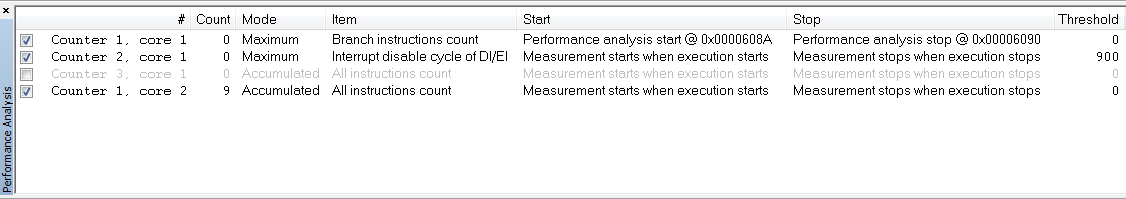
This window displays the results of the performance analysis. Use the check boxes to the left to enable/disable the individual counters.
Context menu
This context menu is available:
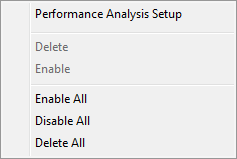
These commands are available:
- Performance Analysis Setup
Opens the dialog box where you configure the analysis.
- Delete
Deletes the counter. Press the Delete key to perform the same command.
- Enable
Enables the counter. The check box at the beginning of the line will be selected. You can also perform the command by manually selecting the check box. This command is only available if the counter is disabled.
- Disable
Disables the counter. The check box at the beginning of the line will be deselected. You can also perform this command by manually deselecting the check box. This command is only available if the counter is enabled.
- Enable All
Enables all defined counters.
- Disable All
Disables all defined counters.
- Delete All
Deletes all defined counters.