- IAR Embedded Workbench for RISC-V 3.40
- C-SPY Debugging
- Interrupts
- Reference information on interrupts
- Interrupt Log Summary window
Interrupt Log Summary window
What do you want to do?
Learn about:
Learn how to:
Get related information:
Get reference information about the Interrupt Log Summary window, see below the line.

The Interrupt Log Summary window is available from the C-SPY driver menu.

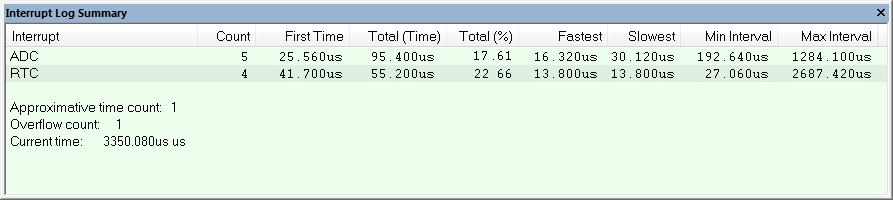
This window displays a summary of logs of entrances to and exits from interrupts.
Requirements
The C-SPY simulator.
Display area
Each row in this area displays statistics about the specific interrupt based on the log information in these columns; and summary information is listed at the bottom of the display area:
- Interrupt
The type of interrupt that occurred.
- Count
The number of times the interrupt occurred.
- First Time
The first time the interrupt was executed.
- Total (Time)**
The accumulated time spent in the interrupt.
- Total (%)
The time in percent of the current time.
- Fastest**
The fastest execution of a single interrupt of this type.
- Slowest**
The slowest execution of a single interrupt of this type.
- Min Interval
The shortest time between two interrupts of this type.
The interval is specified as the time interval between the entry time for two consecutive interrupts.
- Max Interval
The longest time between two interrupts of this type.
The interval is specified as the time interval between the entry time for two consecutive interrupts.
- Approximative time count
The information displayed depends on the C-SPY driver you are using.
For some C-SPY drivers, this information is not displayed or the value is always zero. In this case, all logs have an exact time stamp.
For other C-SPY drivers, a non-zero value is displayed. The value represents the amount of logs with an approximative time stamp. This might happen if the bandwidth in the communication channel is too low compared to the amount of data packets generated by the CPU or if the CPU generated packets with an approximative time stamp.
- Overflow count
The information displayed depends on the C-SPY driver you are using.
For some C-SPY drivers, this information is not displayed or the value is always zero.
For other C-SPY drivers, the number represents the amount of overflows in the communication channel which can cause logs to be lost. If this happens, it indicates that logs might be incomplete. To solve this, make sure not to use all C-SPY log features simultaneously or check used bandwidth for the communication channel.
- Current time/Current cycles
The information displayed depends on the C-SPY driver you are using.
For some C-SPY drivers, the value is always zero or not visible at all.
For other C-SPY drivers, the number represents the current time or cycles—the number of cycles or the execution time since the start of execution.
** Calculated in the same way as for the Execution time/cycles in the Interrupt Log window.
Context menu
This context menu is available:

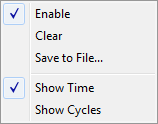
These commands are available:
- Enable
Enables the logging system. The system will log information also when the window is closed.
- Clear
Deletes the log information. Note that this will also happen when you reset the debugger.
- Save to File
Displays a standard file selection dialog box where you can select the destination file for the log information. The entries in the log file are separated by
TABandLFcharacters. An X in the Approx column indicates that the timestamp is an approximation.
- Show Time
Displays the Time column. If the Time column is displayed by default in the C-SPY driver you are using, this menu command is not available.
- Show Cycles
Displays the Cycles column. If the Cycles column is not supported in the C-SPY driver you are using, this menu command is not available.