Monitoring stack usage
These are the two main use cases for the Stack window:
Monitoring stack memory usage
Monitoring the stack memory content.
In both cases, C-SPY retrieves information about the defined stack size and its allocation from the definition in the linker configuration file of the section holding the stack. If you, for some reason, have modified the stack initialization in the system startup code, cstartup, you should also change the section definition in the linker configuration file accordingly, otherwise the Stack window cannot track the stack usage. For more information, see Linking using ILINK.
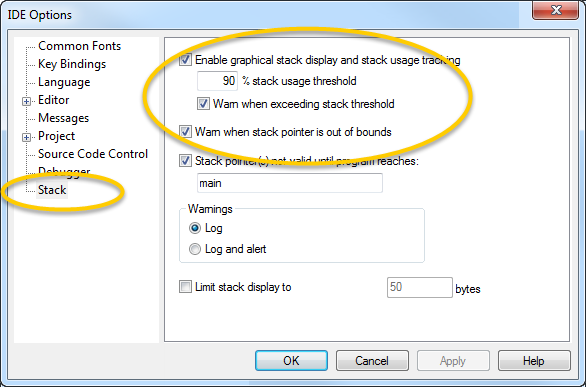
Before you start C-SPY, choose Tools>Options. On the Stack page:
Select Enable graphical stack display and stack usage tracking. This option also enables the option Warn when exceeding stack threshold. Specify a suitable threshold value.
Note also the option Warn when stack pointer is out of bounds. Any such warnings are displayed in the Debug Log window.
Start C-SPY.
When your application is first loaded, and upon each reset, the memory for the stack area is filled with the dedicated byte value
0xCDbefore the application starts executing.Choose View>Stack>Stack 1 to open the Stack window.
Note that you can open up to two Stack windows, each showing a different stack—if several stacks are available—or the same stack with different display settings.
Start executing your application.
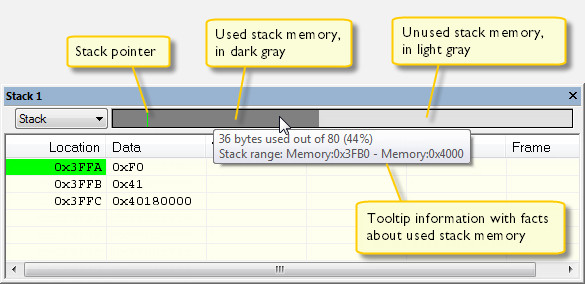
Whenever execution stops, the stack memory is searched from the end of the stack until a byte whose value is not
0xCDis found, which is assumed to be how far the stack has been used. The light gray area of the stack bar represents the unused stack memory area, whereas the dark gray area of the bar represents the used stack memory.For this example, you can see that only 44% of the reserved memory address range was used, which means that it could be worth considering decreasing the size of memory:
Note
Although this is a reasonably reliable way to track stack usage, there is no guarantee that a stack overflow is detected. For example, a stack can incorrectly grow outside its bounds, and even modify memory outside the stack area, without actually modifying any of the bytes near the end of the stack range. Likewise, your application might modify memory within the stack area by mistake.
Before you start monitoring stack memory, you might want to disable the option Enable graphical stack display and stack usage tracking to improve performance during debugging.
Start C-SPY.
Choose View>Stack>Stack 1 to open the Stack window.
Note that you can access various context menus in the display area from where you can change display format, etc.
Start executing your application.
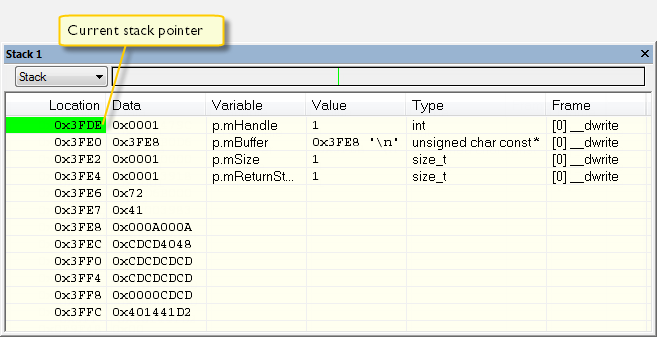
Whenever execution stops, you can monitor the stack memory, for example to see function parameters that are passed on the stack: