- IAR Embedded Workbench for RISC-V 3.40
- C-SPY Debugging
- Trace
- Reference information on trace
- Trace Settings dialog box
Trace Settings dialog box
What do you want to do?
Learn about:
Learn how to:
Get reference information about the Trace Settings dialog box, see below the line.

The Trace Settings dialog box is available from the C-SPY I-jet menu.
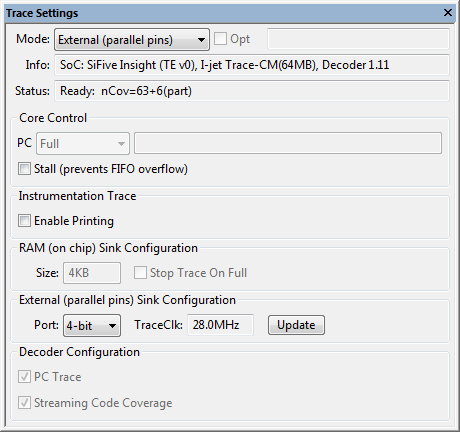
Use this dialog box to configure trace generation and collection.
See also Getting started with trace.
Requirements
The I-jet driver and a device that supports trace.
Mode
The main trace mode. Some changes to the trace mode are not possible during a debug session; see the Debug Log for detailed information.
Note
Not all types of trace can be used by all combinations of debug probe and target hardware. A setting that cannot be used will be ignored; see the Debug Log for detailed information.
Choose between:
- Off (disabled)
This disables I-jet trace completely. If the I-jet trace mode is Off, trace cannot be enabled or used in any trace-related windows for the I-jet driver. This setting ensures that trace modules will not do any reading/writing to the target system.
If, for some reason, trace seems to be available in a debug session when the device you are debugging does not support it, you can use this setting to turn the (non-functional) trace features off.
- Auto (probe dependent)
Selects External, RAM, or Serial trace, in that order, depending on the best match of the capabilities of the debug probe and the trace components of the target system.
- External (parallel pins)
Collects External trace data, see External trace.
- RAM (on chip)
Collects RAM trace data, see RAM trace.
- Serial (serial pin)
Collects Serial trace data, see Serial trace.
Opt
Use this field with device families from some SoC vendors to make settings required to use trace. For detailed information, see the document RISC-V-Trace-Control-Interface.adoc, available on github.com.
Info
Gives information about the target device and the debug probe, showing the amount of probe memory and the version of the decoder that is used for processing trace. This field is read-only.
Status
Displays the status of current trace capture. This field is read-only. The elements that can be displayed in this field are:
- status:
The current status of the trace collection, one of: Ready, Streaming (capturing full trace in real time), Active (capturing and buffering trace), and Done.
- Unread xMB (y%)
If the decoding is slower than the streaming data rate,
xis the amount of raw trace not yet read (y% of the probe trace memory). For RAM trace, or if PC Trace is disabled, this element might be omitted.
- nInst=z
zis the number of instructions that have been decoded from the processed raw trace stream.
- nCov=a+b(part)
ais the number of completely covered instructions andbthe number of partially executed instructions.
Tip
The messages in the Debug Log window give a fuller description of the trace collection.
Stall
Stalls the core to prevent on-chip FIFO overflow. Note that when core is stalled, real-time behavior might be affected. Use this option only when you see trace overflows.
Enable printing
Makes it possible for the executing application to send text to the stdout and stderr streams by way of trace output, rather than by temporarily stopping at a breakpoint.
Using this option requires that the standard C library is configured with the option to direct the stdout/stderr streams via Trace ITC. To configure the library this way, choose Project>Options>General Options>Library Configuration.
Size
Displays the on-chip RAM size when the Mode is set to RAM. This field is read-only.
Stop trace on full
Stops RAM trace collection before the trace buffer becomes full.
Port
Specifies which trace port pins to use when the Mode is set to External. A setting that cannot be used will be ignored; see the Debug Log for detailed information.
TraceClk
The frequency of the trace clock (TraceClk) pin used for External trace, as measured by the debug probe.
Update
Refreshes the measurement of the trace clock frequency.
PC Trace
Shows whether PC Trace records are being produced or not. This check box is read-only—the production of PC Trace records is enabled/disabled in the individual debugger windows that make use of them.
Note
Without PC Trace, the decoding of the trace stream improves as coverage maps and counters can be updated live.
Streaming code coverage
Shows whether code coverage maps and counters are being produced or not. This check box is read-only—streaming code coverage is enabled/disabled in the individual debugger windows that make use of it.