Sampled Graphs window
What do you want to do?
Learn about:
Learn how to:
Get reference information about the Sampled Graphs window, see below the line.

The Sampled Graphs window is available from the C-SPY driver menu.
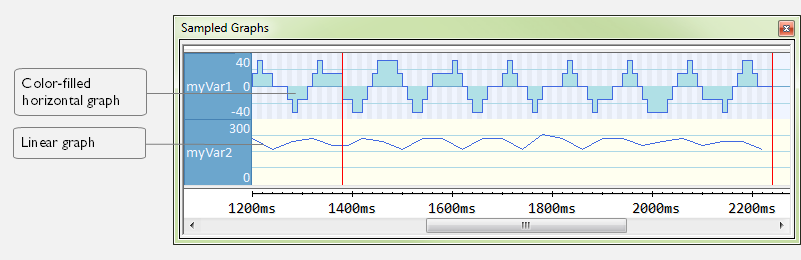
Use this window to display graphs for up to four different variables, and where:
The graph displays how the value of the variable changes over time. The area on the left displays the limits, or range, of the Y-axis for the variable. You can use the context menu to change these limits. The graph is a graphical representation of the information in the Data Sample window, see Data Sample window.
The graph can be displayed as levels, where a horizontal line—optionally color-filled—shows the value until the next sample. Alternatively, the graph can be linear, where a line connects consecutive samples.
A red vertical line indicates the time of application execution stops.
At the bottom of the window, there is a shared time axis that uses seconds as the time unit.
To navigate in the graph, use any of these alternatives:
Right-click and choose Zoom In or Zoom Out from the context menu. Alternatively, use the + and – keys to zoom.
Right-click in the graph and choose Navigate and the appropriate command to move backward and forward on the graph. Alternatively, use any of the shortcut keys: arrow keys, Home, End, and Ctrl+End.
Double-click on a sample to highlight the corresponding source code in the editor window and in the Disassembly window.
Click on the graph and drag to select a time interval. Press Enter or right-click and choose Zoom>Zoom to Selection from the context menu. The selection zooms in.
Tip
Hover with the mouse pointer in the graph to get detailed tooltip information for that location.
See also Getting started using data sampling.
Context menu
This context menu is available:
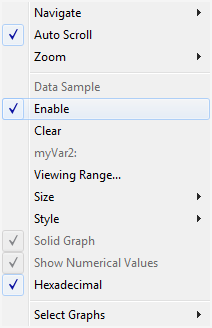
These commands are available:
- Navigate
Commands for navigating in the graphs. Choose between:
Next moves the selection to the next relevant point in the graph. Shortcut key: right arrow.
Previous moves the selection to the previous relevant point in the graph. Shortcut key: left arrow.
First moves the selection to the first data entry in the graph. Shortcut key: Home.
Last moves the selection to the last data entry in the graph. Shortcut key: End.
End moves the selection to the last data in any displayed graph, in other words the end of the time axis. Shortcut key: Ctrl+End.
- Auto Scroll
Toggles automatic scrolling on or off. When on, the most recently collected data is automatically displayed when you choose Navigate>End.
- Zoom
Commands for zooming the window, in other words, changing the time scale. Choose between:
Zoom to Selection makes the current selection fit the window. Shortcut key: Return.
Zoom In zooms in on the time scale. Shortcut key: +
Zoom Out zooms out on the time scale. Shortcut key: -
1us, 10us, 100us makes an interval of 1 microseconds, 10 microseconds, or 100 microseconds, respectively, fit the window.
1ms, 10ms, 100ms makes an interval of 1 millisecond, 10 milliseconds, or 100 milliseconds, respectively, fit the window.
1s, 10s, 100s makes an interval of 1 second, 10 seconds, or 100 seconds, respectively, fit the window.
1k s, 10k s, 100k s makes an interval of 1,000 seconds, 10,000 seconds, or 100,000 seconds, respectively, fit the window.
1M s, 10M s, makes an interval of 1,000,000 seconds or 10,000,000 seconds, respectively, fit the window.
- Open Setup window (Data Sample Graph)
Opens the Data Sample Setup window.
- Enable
Toggles the display of the graph on or off. If you disable a graph, that graph will be indicated as OFF in the window. If no data has been collected for a graph, no data will appear instead of the graph.
- Variable
The name of the variable for which the Data Sample-specific commands below apply. This menu item is context-sensitive, which means it reflects the Data Sample graph you selected in the Sampled Graphs window (one of up to four).
- Viewing Range
Displays a dialog box, see Viewing Range dialog box.
- Hexadecimal
Toggles between displaying the selected value in decimal or hexadecimal format. Note that this setting also affects the log window.