Performance Analysis window
The Performance Analysis window is available from the C-SPY driver menu during a debug session.
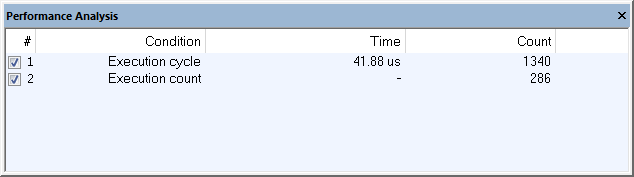
This window displays the performance analysis.
Requirements
A C-SPY hardware debugger driver.
Context menu
This context menu is available:

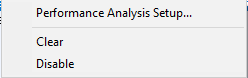
These commands are available:
- Performance Analysis Setup
Displays the Performance Analysis Setup dialog box where you configure the measurement. See Performance Analysis Setup dialog box.
- Clear
Clears all data in the selected row of the display area. If no row is selected, all data is cleared.
- Enable/Disable
Enables or disables the performance analysis. Disabling the analysis does not clear already collected data; re-enabling the analysis and running more passes will append the new data to the previously collected data.
Display area
The display area provides information in these columns:
- #
The number of the analysis counter. The numbers are 1 and 2 when a 32-bit counter is used for both of two ranges or 1 when the two 32-bit counters are handled as a 64-bit counter for measurement of performance in a single address range.
The checkboxes enable/disable each counter.
- Condition
Indicates the measurement type. See the description for the Performance Analysis Setup dialog box.
- Time
The cumulative total of the analyzed execution.
If the measurement type in the Condition column is cycles, the time is calculated from the operating frequency value and the value in the Count column.
If the measurement type in the Condition column is a count, this column displays a –.
- Count
A decimal value that indicates the number of times the measurement has been performed. Any overflows will be indicated.