Start debugging a running application
Using an E1, E20, E2, or E2 Lite/EZ-CUBE2 emulator, you can start debugging a running application at its current location, without resetting the target system.
Make sure that your application is running on the target board and that the target board is powered by external power.
Choose Project>Attach to Running Target. For information about this menu command, see under Project menu.
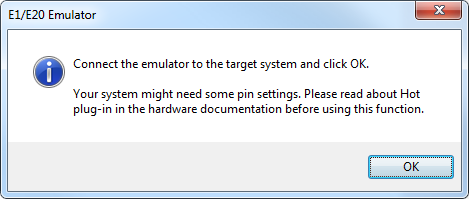
When you are prompted, connect the emulator to the target board and click OK.
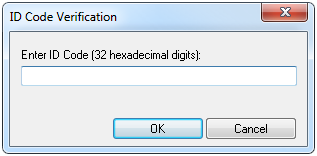
Enter the ID code of the target MCU in the ID Code Verification dialog box.
When the debug session starts, your application is still executing but now you can monitor RAM and look at variables in the Live Watch window.
To stop execution, click Stop or set a breakpoint.
You can now debug your application as usual.