Getting started using the profiler on instruction level
When you have built your application and started C-SPY, choose View>Disassembly to open the Disassembly window, and choose Instruction Profiling>Enable from the context menu that is available when you right-click in the left-hand margin of the Disassembly window.
Make sure that the Show command on the context menu is selected, to display the profiling information.
Start executing your application to collect the profiling information.
When the execution stops, for instance because the program exit is reached or a breakpoint is triggered, you can view instruction level profiling information in the left-hand margin of the window.
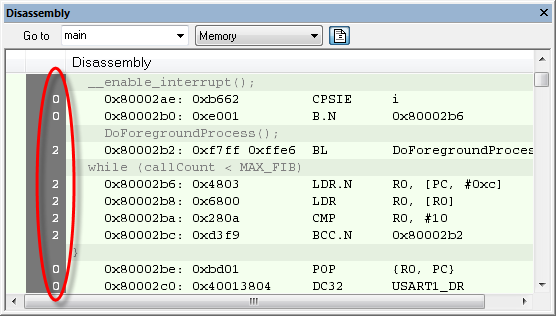
For each instruction, the number of times it has been executed is displayed.
Instruction profiling attempts to use the same source as the function profiler. If the function profiler is not on, the instruction profiler will try to use first trace and then PC sampling as source. You can change the source to be used from the context menu that is available in the Function Profiler window.