- IAR Embedded Workbench for Arm 10.10.x
- C-SPY Debugging
- Trace
- Reference information on trace
- ETM Trace Settings dialog box
ETM Trace Settings dialog box
The ETM Trace Settings dialog box is available from the C-SPY driver menu.
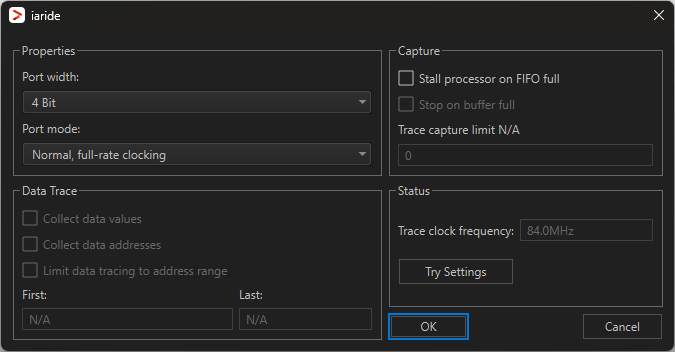
Use this dialog box to configure ETM trace generation and collection.
See also:
Requirements
One of these alternatives:
The C-SPY I-jet driver
The C-SPY J-Link/J-Trace driver
The C-SPY CMSIS-DAP driver
Port width
Specifies the trace bus width, which can be set to 1, 2, 4, 8, or 16-bits. The value must correspond with what is supported by the hardware and the debug probe.
For Cortex-M3, only 1, 2, and 4 bits are supported by the J-Trace debug probe. For Arm7/9, only 4 bits are supported by the J-Trace debug probe.
For the lower values, the risk of FIFO buffer overflow increases, unless you are using the Stall processor on FIFO full option.
Port mode
Specifies the used trace clock rate:
Normal, full-rate clocking
Normal, half-rate clocking
Multiplexed (J-Link/J-Trace only)
Demultiplexed (J-Link/J-Trace only)
Demultiplexed, half-rate clocking (J-Link/J-Trace only)
Note
For the J-Trace driver, the available alternatives depend on the device you are using.
Data Trace (I-jet only)
Selects what type of trace data you want C-SPY to collect. Data trace is only available for Arm7/Arm9/Arm11-based devices with ETM data trace. Choose between:
- Collect data values
Collects data values.
- Collect data addresses
Collects data addresses.
- Limit data tracing to address range
Collects the specified type of data within the address range you specify in the First and Last text boxes.
Capture
Normally, trace collection starts or stops when execution starts or stops, or when a Trace Start or Trace Stop breakpoint is triggered. To change this, choose between:
- Stall processor on FIFO full
Stalls the processor in case the FIFO buffer fills up. The trace FIFO buffer on the CPU might in some situations become full—FIFO buffer overflow—which means trace data will be lost. This can be the case when the CPU is executing several branch instructions close to each other in time, such as in tight loops.
- Stop on buffer full
Stops collecting trace data when the probe buffer is full.
- Trace capture limit (J-Trace only)
Specify the size of the trace buffer. By default, the number of trace frames is
0xFFFF. For Arm7/9 the maximum number is0xFFFFF, and for Cortex-M3 the maximum number is0x3FFFFF. For ARM7/9, one trace frame corresponds to 2 bytes of the physical J-Trace buffer size. For Cortex-M3, one trace frame corresponds to approximately 1 byte of the buffer size.
Status (I-jet only)
Shows the ETM status.
- Trace clock frequency
Shows the frequency of the trace clock to help you determine if the trace hardware is properly configured. Typically, this depends on the settings of Port Width and Port Mode.
- Try settings
Applies the settings you made in this dialog box. The trace clock frequency will be updated.