Timeline window—Call Stack graph
What do you want to do?
Learn about:
Learn how to:
Get related information:
Get reference information about the Timeline window for the call stack, see below the line.

The Timeline window is available from the Driver menu during a debug session.
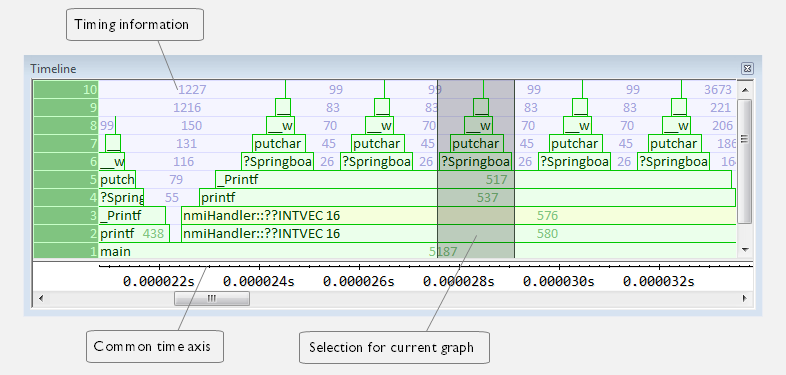
This window displays trace data represented as different graphs, in relation to a shared time axis.
The Call Stack graph displays the sequence of function calls and returns collected by the trace system.
Note
There is a limit on the number of saved logs. When this limit is exceeded, the oldest entries in the buffer are erased.
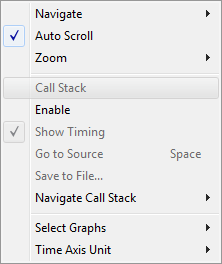
Context menu
This context menu is available:
Note
The contents of this menu are dynamic and depend on which features that your combination of software and hardware supports. However, the list of menu commands below is complete and covers all possible commands.
These commands are available:
- Navigate
Commands for navigating the graph(s). Choose between:
Next moves the selection to the next relevant point in the graph. Shortcut key: right arrow.
Previous moves the selection backward to the previous relevant point in the graph. Shortcut key: left arrow.
First moves the selection to the first data entry in the graph. Shortcut key: Home.
Last moves the selection to the last data entry in the graph. Shortcut key: End.
End moves the selection to the last data in any displayed graph, in other words the end of the time axis. Shortcut key: Ctrl+End.
- Zoom
Commands for zooming the window, in other words, changing the time scale. Choose between:
Zoom to Selection makes the current selection fit the window. Shortcut key: Return.
Zoom In zooms in on the time scale. Shortcut key: +
Zoom Out zooms out on the time scale. Shortcut key: –
10ns, 100ns, 1us, etc makes an interval of 10 nanoseconds, 100 nanoseconds, 1 microsecond, respectively, fit the window.
1ms, 10ms, etc makes an interval of 1 millisecond or 10 milliseconds, respectively, fit the window.
10m, 1h, etc makes an interval of 10 minutes or 1 hour, respectively, fit the window.
- Enable
Toggles the display of the graph on or off. If you disable a graph, that graph will be indicated as OFF in the window. If no data has been collected for a graph, no data will appear instead of the graph.
- Navigate Call Stack>After Current Loop (L)
Identifies the selected program counter and scans the trace data forward, collecting program counters, until it finds the same address again. It has now detected a loop. (Loops longer than 1000 instructions are not detected.) Then it navigates forward until it finds a program counter that is not part of the collected set. This is useful for navigating out of many iterations of an idle or polling loop.
- Navigate Call Stack>Before Current Loop (Shift+L)
Behaves as After Current Loop, but navigates backward out of the loop.
- Navigate Call Stack>After Current Function (U)
Navigates to the next unmatched return instruction. This is similar to stepping out of the current function.
- Navigate Call Stack>Before Current Function (Shift+U)
Navigates to the closest previous unmatched call instruction.
- Navigate Call Stack>Next Statement (S)
Navigates to the next instruction that belongs to a different C statement than the starting point. It skips function calls, i.e. it tries to reach the next statement in the starting frame.
- Navigate Call Stack>Previous Statement (Shift+S)
Behaves as Next statement, but navigates backward to the closest previous different C statement.
- Navigate Call Stack>Next on Same Address (A)
Navigates to the next instance of the starting program counter address, typically to the next iteration of a loop.
- Navigate Call Stack>Previous on Same Address (Shift+A)
Navigates to the closest previous instance of the starting program counter address.
- Navigate Call Stack>Next Interrupt (I)
Navigates to the next interrupt entry. (To then find the matching interrupt exit, follow up with After Current Function.)
- Navigate Call Stack>Previous Interrupt (Shift+I)
Navigates to the closest previous interrupt entry.
- Navigate Call Stack>Next Execution Start Point (E)
Navigates to the next point where the CPU was started, for example places where the application stopped at breakpoints, or was stepped.
- Navigate Call Stack>Previous Execution Start Point (Shift+E)
Navigates to the closest previous point where the CPU was started.
- Navigate Call Stack>Next Discontinuity (D)
Navigates to the next discontinuity in the trace data.
- Navigate Call Stack>Previous Discontinuity (Shift+D)
Navigates to the closest previous discontinuity in the trace data.
- Profile Selection
Enables profiling time intervals in the Function Profiler window. Note that this command is only available if the C-SPY driver supports PC Sampling. See Selecting a time interval for profiling information.