Timeline window—Events graph
What do you want to do?
Learn about:
Learn how to:
Get related information:
Get reference information about the Timeline window for the Events graph, see below the line.

The Timeline window is available from the C-SPY driver menu during a debug session.

This window displays trace data represented as different graphs, in relation to a shared time axis.
The Events graph displays the events produced when the execution passes specific positions in your application code.
Note
There is a limit on the number of saved logs. When this limit is exceeded, the oldest entries in the buffer are erased.
Requirements
One of these alternatives:
The C-SPY I-jet driver and an I-jet debug probe
The C-SPY J-Link/J-Trace driver. For the J-Trace debug probe, event logging is very limited when ETM trace is enabled.
The C-SPY ST-LINK driver
The C-SPY TI XDS driver
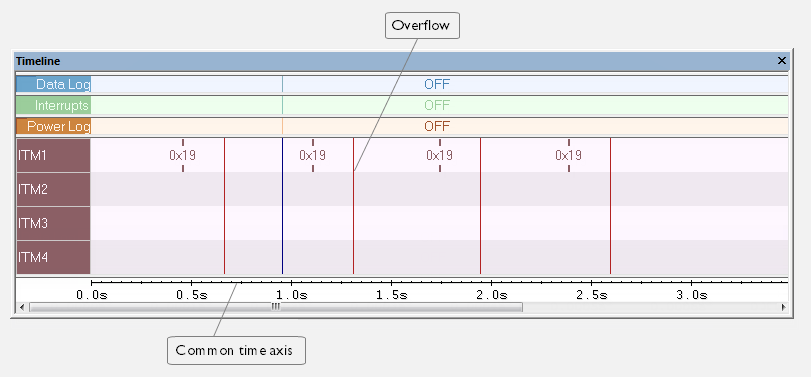
Display area for the Events graph
Where:
The label area at the left end of the graph displays the name of the channel.
For each channel, there will be a vertical line that indicates when the event occurred. Optionally, you can choose to display the event value that was passed with the event.
The graph can be displayed in different styles—as a thin line between consecutive logs, as a rectangle for every log (optionally color-filled), or as vertical bars.
A red vertical line indicates overflow, which means that the communication channel failed to transmit all data logs from the target system.
At the bottom of the window, there is a shared time axis that uses seconds or cycles as the time unit.
See also Getting started using event logging.
Context menu
This context menu is available:

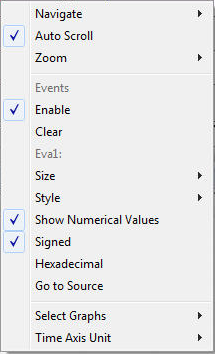
These commands are available:
- Navigate
Commands for navigating the graph(s). Choose between:
Next moves the selection to the next relevant point in the graph. Shortcut key: right arrow.
Previous moves the selection backward to the previous relevant point in the graph. Shortcut key: left arrow.
First moves the selection to the first data entry in the graph. Shortcut key: Home.
Last moves the selection to the last data entry in the graph. Shortcut key: End.
End moves the selection to the last data in any displayed graph, in other words the end of the time axis. Shortcut key: Ctrl+End.
- Zoom
Commands for zooming the window, in other words, changing the time scale. Choose between:
Zoom to Selection makes the current selection fit the window. Shortcut key: Return.
Zoom In zooms in on the time scale. Shortcut key: +
Zoom Out zooms out on the time scale. Shortcut key: –
10ns, 100ns, 1us, etc makes an interval of 10 nanoseconds, 100 nanoseconds, 1 microsecond, respectively, fit the window.
1ms, 10ms, etc makes an interval of 1 millisecond or 10 milliseconds, respectively, fit the window.
10m, 1h, etc makes an interval of 10 minutes or 1 hour, respectively, fit the window.
- Enable
Toggles the display of the graph on or off. If you disable a graph, that graph will be indicated as OFF in the window. If no data has been collected for a graph, no data will appear instead of the graph.
- Clear
Deletes the log information. Note that this will also happen when you reset the debugger.
- Variable
The name of the channel for which the Events-specific commands below apply. This menu command is context-sensitive, which means it reflects the channel in the Events graph you selected in the Timeline window (one of up to four).
- Viewing Range
Displays a dialog box, see Viewing Range dialog box.
- Style
Selects the style of the graph. Choose between:
Bars, displays a vertical bar for each log.
Columns, displays a column for each log.
Levels, displays the graph with a rectangle for each log, optionally color-filled.
Linear, displays the graph as a thin line between consecutive logs.
Note that all styles are not available for all graphs.
- Signed
Toggles between displaying the selected value as a signed or unsigned number. Note that this setting also affects the log window.
- Hexadecimal
Toggles between displaying the selected value in decimal or hexadecimal format. Note that this setting also affects the log window.