Live Watch window
What do you want to do?
Learn about:
Learn how to:
Get reference information about the Live Watch window, see below the line.

The Live Watch window is available from the View menu.
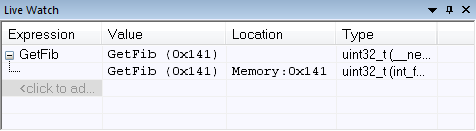
This window repeatedly samples and displays the value of expressions while your application is executing. Variables in the expressions must be statically located, such as global variables.
The following possibilities for live watch apply:
Device | |
|---|---|
Cortex-M | Live watch is fully supported for Cortex-M. Access to memory or setting breakpoints is always possible during execution. |
Cortex-A/R | Live watch is only possible when you use the C-SPY I-jet driver or J-Link/J-Trace driver, and only when you use the option |
Armxxx-S | The support for live watch is limited for Armxxx-S cores, see below. Setting hardware breakpoints during execution is always possible for all supported C-SPY drivers. |
Arm7/Arm9, including Armxxx-S, and when using the C-SPY J-Link/J-Trace driver | Memory accesses must be made by your application. By adding a small program—a DCC handler—that communicates with the debugger through the DCC unit to your application, memory can be read/written during execution. Software breakpoints can also be set by the DCC handler. Just add the files In your local copy of the |
Context menu
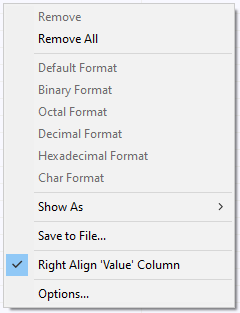
This context menu is available:
Note
The contents of this menu are dynamic and depend on which features that your combination of software and hardware supports. However, the list of menu commands below is complete and covers all possible commands.
These commands are available:
- Remove
Removes the selected expression from the window.
- Remove All
Removes all expressions listed in the window.
- Default Format, Binary Format, Octal Format, Decimal Format, Hexadecimal Format, Char Format
Changes the display format of expressions. The display format setting affects different types of expressions in different ways. Your selection of display format is saved between debug sessions. These commands are available if a selected line in the window contains a variable.
The display format setting affects different types of expressions in these ways:
Variables
The display setting affects only the selected variable, not other variables.
Array elements
The display setting affects the complete array, that is, the same display format is used for each array element.
Structure fields
All elements with the same definition—the same field name and C declaration type—are affected by the display setting.
- Show As
Displays a submenu that provides commands for changing the default type interpretation of variables. The commands on this submenu are mainly useful for assembler variables—data at assembler labels—because these are, by default, displayed as integers.For more information, see Viewing assembler variables.
- Save to File
Saves content to a file in a tab-separated format.
- Right Align ‘Value’ Column
Right-aligns the contents of the Value column.
- Options
Displays the IDE Options dialog box where you can set various options for C-SPY windows.