Function Trace window
What do you want to do?
Learn about:
Learn how to:
Get reference information about the Function Trace window, see below the line.

The Function Trace window is available from the C-SPY driver menu during a debug session.
This window displays a subset of the trace data displayed in the Trace window. Instead of displaying all rows, the Function Trace window shows:
The functions called or returned to, instead of the traced instruction
The corresponding trace data.
Display area (in the C-SPY simulator)
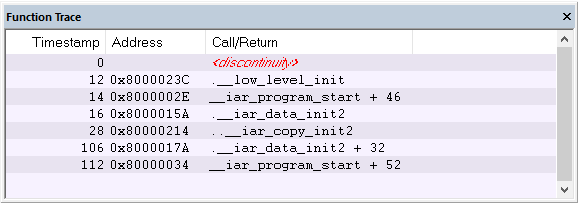
- Cycles
The number of cycles elapsed to this point according to the timestamp in the debug probe.
- Address
The address of the executed instruction.
- Call/Return
The function that was called or returned to.
Display area (for a supported emulator)
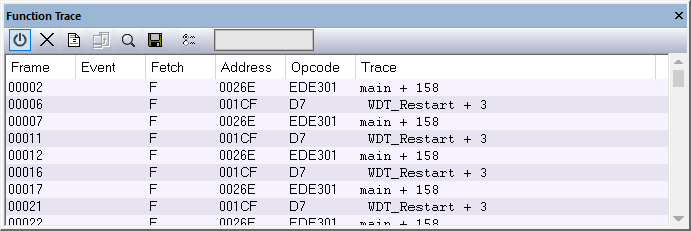
This area contains these columns for the supported C-SPY emulators:
- Frame
The number of the trace buffer frame. By double-clicking the frame number, the collected fetch address will be displayed in the editor window.
- Event
The name of the single events that have been triggered by the event conditions. For information about event conditions, see Edit Events dialog box and Edit Sequencer Events dialog box.
- Fetch
The fetch type of the instruction associated with the trace frame.
For the E1, E2, E2 Lite/E2 On-Board, EZ-CUBE2, and COM Port emulators, this is one of:
F— a verified trace frameS— a verified trace frame based on section trace+— a calculated trace frameFi— an interrupt trace frame+?— a trace frame that might have been skipped (it cannot be determined whether it has been executed)...— a trace restart (to resynchronize the trace and the execution)
- Address
The address of the executed instruction.
- Opcode
The operation code of the instruction associated with the trace frame. After the hexadecimal value, extra information can be displayed—x2 if two instructions were executed and C if the instruction was read from the I-Cache.
- Trace
The collected sequence of executed machine instructions. Optionally, the corresponding source code can also be displayed.