CMSIS-DAP menu
When you are using the C-SPY CMSIS-DAP driver, the CMSIS-DAP menu is added to the menu bar.
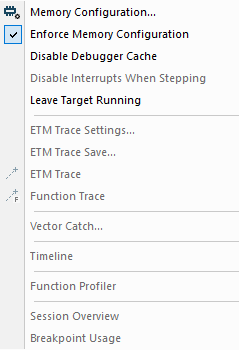
Menu commands
These commands are available on the menu:
- Memory Configuration
Displays a dialog box, see Memory Configuration dialog box for C-SPY hardware debugger drivers.
- Enforce Memory Configuration
Prevents the driver from accessing any memory ranges in the zone
Memorythat have not been defined in the Memory Configuration dialog box.
- Disable Debugger Cache
Disables memory caching and memory range checking in C-SPY.
Normally, C-SPY uses the memory range information in the Memory Configuration dialog box both to restrict access to certain parts of target memory and to cache target memory contents for improved C-SPY performance. Under certain rare circumstances, this is not appropriate, and you can choose Disable Debugger Cache to turn off the caching and memory range checking completely. All accesses from C-SPY will then result in corresponding accesses to the target system. Some of those circumstances are:
When memory is remapped at runtime and cannot be specified as a fixed set of ranges.
When the memory range setup is incorrect or incomplete.
- Disable Interrupts When Stepping
Ensures that only the stepped statements will be executed. Interrupts will not be executed. This command can be used when not running at full speed and some interrupts interfere with the debugging process.
- Leave Target Running
Leaves the application running on the target hardware after the debug session is closed.
Because existing breakpoints might not be automatically removed, consider disabling all breakpoints before using this menu command.
- ETM Trace Settings
Displays a dialog box, see ETM Trace Settings dialog box (I-jet).
- ETM Trace Save
Displays a dialog box, see Trace Save dialog box.
- ETM Trace
Opens the ETM Trace window, see Trace window.
- Function Trace
Opens a window, see Function Trace window.
- Vector Catch
Displays a dialog box for setting a breakpoint directly on a vector in the interrupt vector table, see Vector Catch dialog box. Note that this command is not available for all Arm cores.
- Timeline
Opens a window, see The application timeline.
This menu command is only available when the SWD/SWO interface is used.
- Function Profiler
Opens a window which shows timing information for the functions, see Function Profiler window.
- Session Overview
Displays a window that lists information about the debug session, such as details about project settings, session settings, and the session state. To save the contents of the window to a file, choose Save As from the context menu.
- Breakpoint Usage
Opens a window which lists all active breakpoints, see Breakpoint Usage window.