Emulator menu
When you are using the C-SPY E1/E2/E20 driver, the Emulator menu is added to the menu bar.
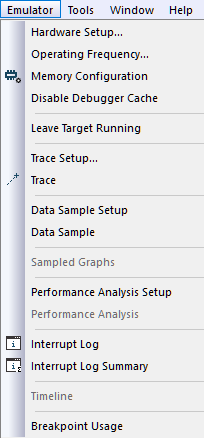
Menu commands
These commands are available on the menu:
- Hardware Setup
Displays a dialog box for basic configuration of the emulator, see Hardware Setup dialog box.
- Operating Frequency
Displays a dialog box where you can inform the emulator of the operating frequency that the MCU is running at, see Operating Frequency dialog box.
- Memory Configuration
Displays a dialog box; see Memory Configuration dialog box for C-SPY hardware debugger drivers.Memory Configuration dialog box for C-SPY hardware debugger drivers
- Disable Debugger Cache
Disables memory caching and memory range checking in C-SPY.
Normally, C-SPY uses the memory range information in the Memory Configuration dialog box both to restrict access to certain parts of target memory and to cache target memory contents for improved C-SPY performance. Under certain rare circumstances, this is not appropriate, and you can choose Disable Debugger Cache to turn off the caching and memory range checking completely. All accesses from C-SPY will then result in corresponding accesses to the target system. Some of those circumstances are:
When memory is remapped at runtime and cannot be specified as a fixed set of ranges.
When the memory range setup is incorrect or incomplete.
- Leave Target Running
Leaves the application running on the target hardware after the debug session is closed.
Warning
Because existing breakpoints might not be automatically removed, consider disabling all breakpoints before using this command.
If this menu command is not available, it is not supported by the C-SPY driver you are using.
- Trace Setup
Displays a dialog box where you can configure the trace generation and collection, see Trace Setup dialog box.
- Trace
Opens a window which displays the collected trace data, see Trace window.Trace window
- Data Sample Setup
Opens a window where you can specify variables to sample data for, see Data Sample Setup window.
- Data Sample
Opens a window where you can view the result of the data sampling, see Data Sample window.
- Sampled Graphs
Opens a window which gives a graphical view of various kinds of sampled information, see Sampled Graphs window.
- Performance Analysis Setup
Displays a dialog box where you can configure the code performance analysis, see Performance Analysis Setup dialog box.
- Performance Analysis
Opens a window which displays the results of the code performance analysis, see Performance Analysis window.
- Interrupt Log
Opens a window which displays the status of all defined interrupts, see Interrupt Log window.Interrupt Log window
- Interrupt Log Summary
Opens a window which displays a summary of the status of all defined interrupts, see Interrupt Log Summary window.Interrupt Log Summary window
- Timeline
Opens a window which gives a graphical view of various kinds of information on a timeline, see The application timeline.
- Breakpoint Usage
Displays a window which lists all active breakpoints, see Breakpoint Usage window.