Reference information on the profiler
Function Profiler window
What do you want to do?
Learn about:
Learn how to:
Get reference information about the Function Profiler window, see below the line.

The Function Profiler window is available from the C-SPY driver menu.
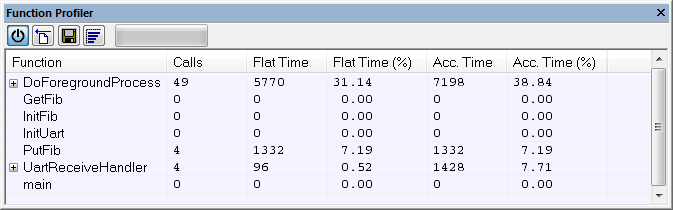
This window displays function profiling information.
When Trace (flat) is selected, a checkbox appears on each line in the left-side margin of the window. Use these checkboxes to include or exclude lines from the profiling. Excluded lines are dimmed but not removed.
Toolbar
The toolbar contains:
- Enable/Disable

Enables or disables the profiler.
- Clear

Clears all profiling data.
- Save

Opens a standard Save As dialog box where you can save the contents of the window to a file, with tab-separated columns. Only non-expanded rows are included in the list file.
- Graphical view

Overlays the values in the percentage columns with a graphical bar.
- Progress bar
Displays a backlog of profiling data that is still being processed. If the rate of incoming data is higher than the rate of the profiler processing the data, a backlog is accumulated. The progress bar indicates that the profiler is still processing data, but also approximately how far the profiler has come in the process.
Note that because the profiler consumes data at a certain rate and the target system supplies data at another rate, the amount of data remaining to be processed can both increase and decrease. The progress bar can grow and shrink accordingly.
Context menu
This context menu is available:
The contents of this menu depend on the C-SPY driver you are using.
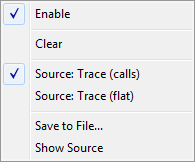
These commands are available:
- Enable
Enables the profiler. The system will also collect information when the window is closed.
- Clear
Clears all profiling data.
- Filtering
Selects which part of your code to profile. Choose between:
Check All—Excludes all lines from the profiling.
Uncheck All—Includes all lines in the profiling.
Load—Reads all excluded lines from a saved file.
Save—Saves all excluded lines to a file. Typically, this can be useful if you are a group of engineers and want to share sets of exclusions.
These commands are only available when using Trace (flat).
- Source
Selects which source to be used for the profiling information. See also Profiling sources.
Note that the available sources depend on the C-SPY driver you are using.
Choose between:
Trace (calls)—the instruction count for instruction profiling is only as complete as the collected trace data.
Trace (flat)—the instruction count for instruction profiling is only as complete as the collected trace data.
- Save to File
Saves all profiling data to a file.
- Show Source
Opens the editor window (if not already opened) and highlights the selected source line.