Editor window
What do you want to do?
Learn about the editor, see Introduction to the IAR Embedded Workbench editor
Learn how to:
Get reference information about the editor window, see below the line.

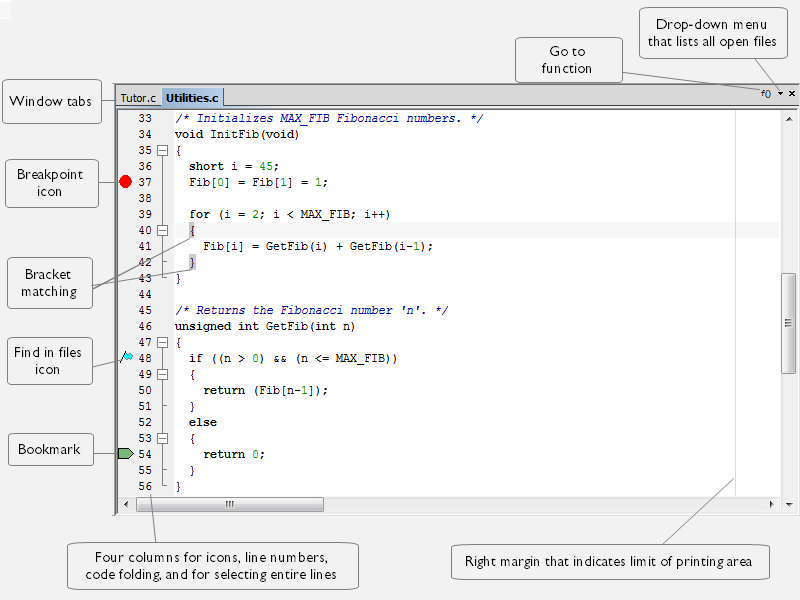
The editor window is opened when you open or create a text file in the IDE.
You can open one or several text files, either from the File menu, or by double-clicking them in the Workspace window. All open files are available from the drop-down menu at the upper right corner of the editor window. Several editor windows can be open at the same time.
Source code files and HTML files are displayed in editor windows. From an open HTML document, hyperlinks to HTML files work like in an ordinary web browser. A link to an eww workspace file opens the workspace in the IDE, and closes any currently open workspace and the open HTML document.
When you want to print a source file, it can be useful to enable the option Show line numbers—available by choosing Tools>Options>Editor.
The editor window is always docked, and its size and position depend on other currently open windows.
For more information about using the editor, see Editing a file and Programming assistance.
Syntax feedback
The editor is capable of giving feedback on the code in an editor window as you type. Code that is identified as having suspected or verified syntactic issues will be indicated by squiggly lines. The issue might or might not be a real compiler problem.
If you hover over a squiggly line, a tooltip will identify the nature of the issue:
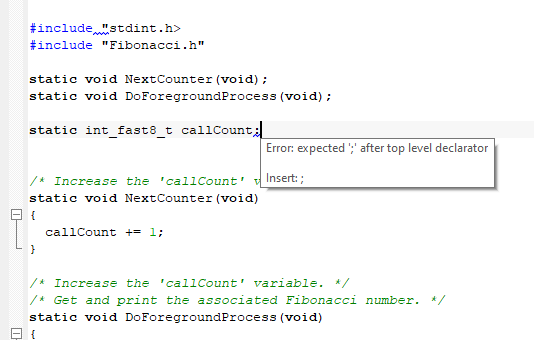
If there is a potential simple fix for the identified issue, the tooltip will suggest it. To apply the suggested fix, choose Apply Syntax Feedback Fix from the Edit menu or the editor window context menu.
Syntax feedback is based on source browser information and is not available during a debugging session.
To enable or disable syntax feedback, and to configure the level of feedback provided, see Editor Syntax Feedback options.
Window tabs, tab groups, and tab context menu
The name of the open file is displayed on the tab. If you open several files, they are organized in a tab group. Click the tab for the file that you want to display. If a file has been modified after it was last saved, an asterisk appears on the tab after the filename, for example Utilities.c *. If a file is read-only, a padlock icon is visible on the tab.
The tab’s tooltip shows the full path and a remark if the file is not a member of the active project.
A context menu appears if you right-click on a tab in the editor window.
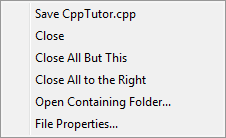
These commands are available:
- Save file
Saves the file.
- Close
Closes the file.
- Close All But This
Closes all tabs except the current tab.
- Close All to the Right
Closes all tabs to the right of the current tab.
- File Properties
Displays a standard File Properties dialog box.
Go to function
Click the Go to function button  in the top right-hand corner of the editor window to list all functions of the C or C++ editor window.
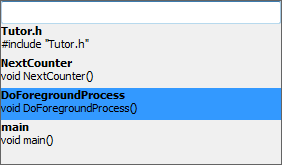
Filter the list by typing the name of the function you are looking for. Then click the name of the function that you want to show in the editor window.
To close the list without moving the cursor from its original position in the editor window, press Esc.
Context menu
This context menu is available:
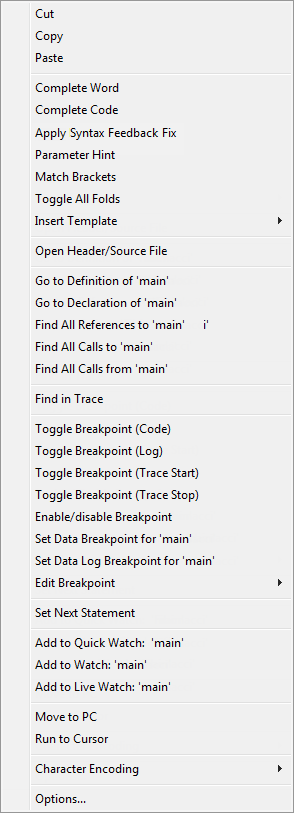
The contents of this menu depend on whether the debugger is started or not, and on the C-SPY driver you are using. Typically, additional breakpoint types might be available on this menu. For information about available breakpoints, see Breakpoint types.
These commands are available:
- Cut, Copy, Paste
Standard window commands.
- Complete Word
Attempts to complete the word you have begun to type, basing the guess on the contents of the rest of the editor window.
- Complete Code
Shows a list of classes, functions, variables, etc, that are available when you type. For more information, see Code completion.
- Apply Syntax Feedback Fix
Applies the suggested fix for the syntactic issue identified by the Syntax feedback feature.
- Parameter Hint
Suggests parameters as tooltip information for the function parameter list you have begun to type. For more information, see Parameter hint.
- Match Brackets
Selects all text between the brackets immediately surrounding the insertion point, increases the selection to the next hierarchic pair of brackets, or beeps if there is no higher bracket hierarchy.
- Toggle All Folds
Expands/collapses all code folds in the current editor window.
- Insert Template
Displays a list in the editor window from which you can choose a code template to be inserted at the location of the insertion point. If the code template you choose requires any field input, the Template dialog box appears. For more information about this dialog box, see Template dialog box. For information about using code templates, see Using and adding code templates.
- Open "header.h"
Opens the header file
header.hin an editor window. If more than one header file with the same name is found and the IDE does not have access to dependency information, the Resolve File Ambiguity dialog box is displayed, see Resolve File Ambiguity dialog box. This menu command is only available if the insertion point is located on an#includeline when you open the context menu.
- Open Header/Source File
Opens the header or source code file that has same base name as the current file. If the destination file is not open when you choose the command, the file will first be opened. This menu command is only available if the insertion point is located on any line except an
#includeline when you open the context menu. This command is also available from the File>Open menu.
- Go to Definition of symbol
Places the insertion point at the definition of the symbol. If no definition is found in the source code, the first declaration will be used instead. If more than one possible definition is found, they are listed in the Ambiguous Definitions window. See Ambiguous Definitions window.
- Go to Declaration of symbol
If only one declaration is found, the command puts the insertion point at the declaration of the symbol. If more than one declaration is found, these declarations are listed in the Declarations window.
- Find All References to symbol
The references are listed in the References window.
- Find All Calls to symbol
Opens the Call Graph window which displays all functions in the project that calls the selected function, see Call Graph window. If this command is disabled, make sure to select a function in the editor window.
- Find in Trace
Searches the contents of the Trace window for occurrences of the given location—the position of the insertion point in the source code—and reports the result in the Find in Trace window. This menu command requires support for trace in the C-SPY driver you are using, see Trace.
- Toggle Breakpoint (Code)
Toggles a code breakpoint at the statement or instruction containing or close to the cursor in the source window. For information about code breakpoints, see Code breakpoints.
- Toggle Breakpoint (Log)
Toggles a log breakpoint at the statement or instruction containing or close to the cursor in the source window. For information about log breakpoints, see Log breakpoints.
- Toggle Breakpoint (Trace Start)
Toggles a Trace Start breakpoint. When the breakpoint is triggered, trace data collection starts. For information about Trace Start breakpoints, see Trace Start/Stop Trigger breakpoints. Note that this menu command is only available if the C-SPY driver you are using supports trace.
- Toggle Breakpoint (Trace Stop)
Toggles a Trace Stop breakpoint. When the breakpoint is triggered, trace data collection stops. For information about Trace Stop breakpoints, see Trace Start/Stop Trigger breakpoints. Note that this menu command is only available if the C-SPY driver you are using supports trace.
- Enable/disable Breakpoint
Toggles a breakpoint between being disabled, but not actually removed—making it available for future use—and being enabled again.
- Set Data Breakpoint for 'variable'
Toggles a data log breakpoint on variables with static storage duration. Requires support in the C-SPY driver you are using. For more information about data breakpoints, see Data breakpoints.
- Set Data Log Breakpoint for 'variable'
Toggles a data log breakpoint on variables with static storage duration. Requires support in the C-SPY driver you are using. The breakpoints you set in this window will be triggered by both read and write accesses—to change this, use the Breakpoints window. For more information about data logging and data log breakpoints, see Data Log breakpoints.
- Edit Breakpoint
Displays the Edit Breakpoint dialog box to let you edit the breakpoint available on the source code line where the insertion point is located. If there is more than one breakpoint on the line, a submenu is displayed that lists all available breakpoints on that line.
- Set Next Statement
Sets the Program Counter directly to the selected statement or instruction without executing any code. This menu command is only available when you are using the debugger. For more information, see C-SPY Debugger main window.
- Add to Quick Watch: symbol
Opens the Quick Watch window and adds the symbol, see Quick Watch window. This menu command is only available when you are using the debugger.
- Add to Watch: symbol
Opens the symbol to the Watch window and adds the symbol. This menu command is only available when you are using the debugger.
- Add to Live Watch: symbol
Opens the Live Watch window and adds the symbol, see Live Watch window. This menu command is only available when you are using the debugger.
- Move to PC
Moves the insertion point to the current PC position in the editor window. This menu command is only available when you are using the debugger.
- Run to Cursor
Executes from the current statement or instruction up to the statement or instruction where the insertion point is located. This menu command is only available when you are using the debugger.
- Character Encoding
Interprets the source file according to the specified character encoding. Choose between:
System (uses the Windows settings)
Western European
UTF-8
Japanese (Shift-JIS)
Chinese Simplified (GB2312)
Chinese Traditional (Big5)
Korean (Unified Hangul Code)
Arabic
Baltic
Central European
Greek
Hebrew
Russian
Thai
Vietnamese
Convert to UTF-8 (converts the document to UTF-8)
Use one of these settings if the Auto-detect character encoding option could not determine the correct encoding or if the option is deselected. For more information about file encoding, see Editor options.
- Options
Displays the IDE Options dialog box, see Tools menu.