E2/E2 Lite/EZ-CUBE2 menu
When you are using the C-SPY E2/E2 Lite/EZ-CUBE2 driver, the E2/E2 Lite/EZ-CUBE2 menu is added to the menu bar.
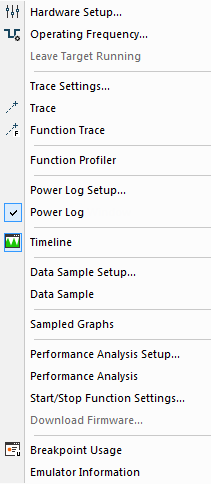
Menu commands
These commands are available on the menu:
- Hardware Setup
Displays a dialog box where you can configure how the emulator operates, see Hardware Setup dialog box: MCU.
- Operating Frequency
Displays a dialog box where you can inform the emulator of the operating frequency that the MCU is running at, see Operating Frequency dialog box.
- Trace Settings
Displays a dialog box where you can configure the trace generation and collection, see Trace Settings dialog box.
- Trace
Opens a window which displays the collected trace data, see Trace window.
- Function Trace
Opens a window which displays the trace data for function calls and function returns, see Function Trace window.
- Function Profiler
Opens a window which shows timing information for the functions, see Function Profiler window.
- Power Log Setup
Opens a window where you can configure the power measurement; see Power Log Setup window.
- Power Log
Opens a window that displays collected power values; see Power Log window.
- Timeline
Opens a window which gives a graphical view of various kinds of information on a timeline, see Timeline window—Power graph.
- Data Sample Setup
Opens a window where you can specify variables to sample data for, see Data Sample Setup window.
- Data Sample
Opens a window where you can view the result of the data sampling, see Data Sample window.
- Sampled Graphs
Opens a window which gives a graphical view of various kinds of sampled information, see Sampled Graphs window.
- Performance Analysis Setup
Displays a dialog box where you can configure the code performance analysis, see Performance Analysis Setup dialog box.
- Performance Analysis
Opens a window which displays the results of the code performance analysis, see Performance Analysis window.
- Start/Stop Function Settings
Displays a dialog box where you can configure the emulator to execute specific routines of your application immediately before the execution starts and/or after it halts, see Start/Stop Function Settings dialog box.
- Download Firmware
Displays a dialog box where you can update the firmware of your emulator if needed, see Download Emulator Firmware dialog box.
- Breakpoint Usage
Displays a window which lists all active breakpoints, see Breakpoint Usage window.
- Emulator Information
Displays a dialog box with version information about the emulator and the emulator firmware, and related information, see Emulator information window.