Debug menu
The Debug menu provides commands for debugging the current project and downloading your application to the target device. When C-SPY is running the menu also provides commands for executing the application.
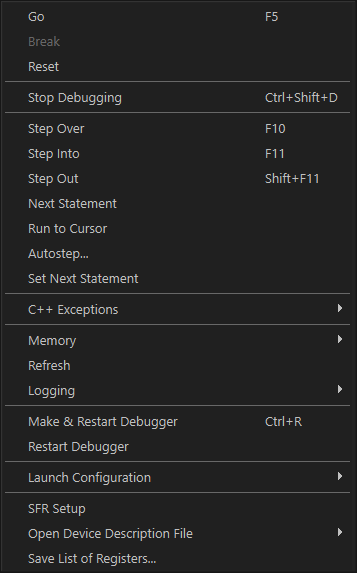
Menu commands
These commands are available:
- Go (F5)
Executes from the current statement or instruction until a breakpoint or program exit is reached. This command is only available during a debug session.
Note
If you are using symmetric multicore debugging, the Go command starts only the core in focus.
- Break
Stops the application execution. This command is only available during a debug session.
Note
If you are using symmetric multicore debugging, the Break command stops only the core in focus.
- Reset
Resets the target processor. This command is only available during a debug session. Click the drop-down arrow on the corresponding debug menu button to access a menu with additional commands:
Enable Run to 'label', where
labeltypically ismain. Enables and disables the project option Run to without exiting the debug session. This menu command is only available if you have selected Run to in the Options dialog box.Reset strategies, which contains a list of reset strategies supported by the C-SPY driver you are using. This means that you can choose a different reset strategy than the one used initially without exiting the debug session. Reset strategies are only available if the C-SPY driver you are using supports alternate reset strategies.
- Stop Debugging (Ctrl+Shift+D)
Stops the debugging session and returns you to the project manager. This command is only available during a debug session.
- Step Over (F10)
Executes the next statement, function call, or instruction, without entering C or C++ functions or assembler subroutines. This command is only available during a debug session.
- Step Into (F11)
Executes the next statement or instruction, or function call, entering C or C++ functions or assembler subroutines. This command is only available during a debug session.
- Step Out (Shift+F11)
Executes from the current statement up to the statement after the call to the current function. This command is only available during a debug session.
- Next Statement
Executes directly to the next statement without stopping at individual function calls. This command is only available during a debug session.
- Run to Cursor
Executes from the current statement or instruction up to a selected statement or instruction. This command is only available during a debug session.
- Autostep
Displays a dialog box where you can customize and perform autostepping, see Autostep settings dialog box. This command is only available during a debug session.
- Set Next Statement
Moves the program counter directly to where the cursor is, without executing any source code. Note, however, that this creates an anomaly in the program flow and might have unexpected effects. This command is only available during a debug session.
- C++ Exceptions>Break on Throw
Specifies that the execution shall break when the target application executes a
throwstatement. This command is only available during a debug session.To use this feature, your application must be built with the option Library low-level interface implementation selected and the language option C++ With exceptions.
- C++ Exceptions>Break on Uncaught Exception
Specifies that the execution shall break when the target application throws an exception that is not caught by any matching
catchstatement. This command is only available during a debug session.To use this feature, your application must be built with the option Library low-level interface implementation selected and the language option C++ With exceptions.
- Memory>Save
Displays a dialog box where you can save the contents of a specified memory area to a file, see Memory Save dialog box. This command is only available during a debug session.
- Memory>Restore
Displays a dialog box where you can load the contents of a file in, for example Intel-extended or Motorola s-record format to a specified memory zone, see Memory Restore dialog box. This command is only available during a debug session.
- Refresh
Refreshes the contents of all debugger windows. Because window updates are automatic, this is needed only in unusual situations, such as when target memory is modified in ways C-SPY cannot detect. It is also useful if code that is displayed in the Disassembly window is changed. This command is only available during a debug session.
- Logging>Set Terminal I/O Log file
Displays a dialog box where you can choose to log simulated target access communication to a file. You can select the destination of the log file. See Terminal I/O Log File dialog box. This command is only available during a debug session.
- Download and Debug (Ctrl+D)
Downloads the application and starts C-SPY so that you can debug the project object file. If necessary, a make will be performed before running C-SPY to ensure the project is up to date. This command is not available during a debug session.
- Debug without Downloading
Starts C-SPY so that you can debug the project object file. This menu command is a shortcut for the Suppress Download option available on the Download page. The Debug without Downloading command is not available during a debug session.
- Attach to Running Target
Makes the debugger attach to a running application at its current location, without resetting the target system. If you have defined any breakpoints in your project, the C-SPY driver will set them during attachment. If the C-SPY driver cannot set them without stopping the target system, the breakpoints will be disabled. The option also suppresses download and the Run to option. This option is not available during a debug session.
Note that the option is not supported by all combinations of C-SPY driver and device.
- Make & Restart Debugger
Stops C-SPY, makes the active build configuration, and starts the debugger again—all in a single command. This command is only available during a debug session.
- Restart Debugger
Stops C-SPY and starts the debugger again—all in a single command. This command is only available during a debug session.
- Download
Commands for flash download and erase. They are not available during a debug session. Choose between:
Download active application downloads the active application to the target without launching a full debug session. The result is roughly equivalent to launching a debug session but exiting it again before the execution starts.
Download file opens a standard Open dialog box where you can specify a file to be downloaded to the target system without launching a full debug session.
Erase memory erases all parts of the flash memory.
If your
.boardfile specifies only one flash memory, a simple confirmation dialog box is displayed where you confirm the erasure. However, if your.boardfile specifies two or more flash memories, the Erase Memory dialog box is displayed. For information about this dialog box, see Erase Memory dialog box.
- Launch Configuration
Commands for saving and reloading debugger launch settings. Choose between:
Export as JSON exports the current debug configuration as a JSON file, to be reused in the future or shared with a colleague or IAR Technical Support.
Reload Launch File re-reads the currently loaded launch configuration file, and initializes the debugger with the settings. (The debugger needs some initialization, even when not running a debug session). You will also be prompted to reload when you start the debugger if a specified launch configuration file is newer than a previously loaded file with the same name.
Show Resolved (Developer) displays a window with the complete debugger configuration. This is mostly useful for troubleshooting.
For more information about debug launch configurations, see Saving and loading debugger launch settings.
- SFR Setup
Opens the SFR Setup window which displays the currently defined SFRs that C-SPY has information about. For more information about this window, see SFR Setup window.
- Open Device Description File
Opens a submenu where you can choose to open a file from a list of all device files and SFR definitions files that are in use.
- Save List of Registers
Generates a list of all defined registers, including SFRs, with information about the size, location, and access type of each register. If you are in a debug session, the list also includes the current value of the register. This menu command is only available when a project is loaded in the IDE.