I-jet menu
When you are using the C-SPY I-jet driver, the I-jet menu is added to the menu bar.
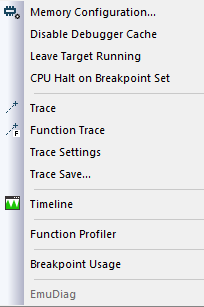
Menu commands
These commands are available on the menu:
- Memory Configuration
Displays a dialog box, see Memory Configuration dialog box for C-SPY hardware debugger drivers.
- Disable Debugger Cache
Disables memory caching and memory range checking in C-SPY.
Normally, C-SPY uses the memory range information in the Memory Configuration dialog box both to restrict access to certain parts of target memory and to cache target memory contents for improved C-SPY performance. Under certain rare circumstances, this is not appropriate, and you can choose Disable Debugger Cache to turn off the caching and memory range checking completely. All accesses from C-SPY will then result in corresponding accesses to the target system. Some of those circumstances are:
When memory is remapped at runtime and cannot be specified as a fixed set of ranges.
When the memory range setup is incorrect or incomplete.
- Trace
Opens the Trace window, see Trace window.
- Function Trace
Opens the Function Trace window, see Function Trace window.
- Trace Settings
Displays a dialog box, see Trace Settings dialog box.
- Trace Save
Displays a standard Save As dialog box where you can save the collected trace data to a text file, with tab-separated columns.
- Timeline
Opens a window, see Reference information on application timeline.
- Function Profiler
Opens a window which shows timing information for the functions, see Function Profiler window.
- Breakpoint Usage
Opens a window which lists all active breakpoints, see Breakpoint Usage window.
- EmuDiag
Starts the EmuDiag application where you can diagnose the connection between the host computer, the probe, and the board.