Emulator menu
When you are using a C-SPY hardware debugger driver, the Emulator menu is added to the menu bar.
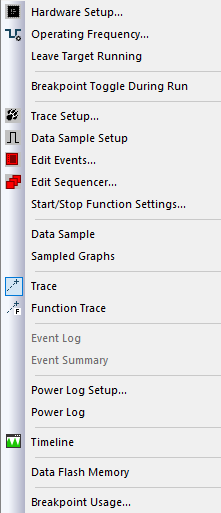
Menu commands
These commands are available on the menu:
- Hardware Setup

To display the driver-specific Hardware Setup dialog box, where you can make the basic configuration for the emulator, click to the left of this command when C-SPY is not running to place a checkmark next to it. The next time you start C-SPY, the dialog box will be displayed. See Hardware Setup.
- Operating Frequency
Displays a dialog box where you can inform the emulator of the operating frequency that the MCU is running at, see Operating Frequency dialog box.
- Leave Target Running
Leaves the application running on the target hardware after the debug session is closed.
Warning
Because existing breakpoints might not be automatically removed, consider disabling all breakpoints before using this option.
If this menu command is not available, it is not supported by the C-SPY driver you are using.
- Trace Setup

Displays a dialog box where you can configure the trace generation and collection, see Reference information on trace.
- Data Sample Setup

Opens a window where you can specify variables to sample data for, see Data Sample Setup window.
- Edit Events

Displays the driver-specific Edit Events dialog box, in which the events used as breakpoint, trace, timer, trigger output, and sequencer events can be defined; see Edit Events dialog box. When this dialog box is active, you can still access other elements in the IDE.
- Edit Sequencer

Displays the driver-specific Edit Sequencer Events dialog box, in which you can define sequences of events that must occur before a sequencer event is triggered; see Edit Sequencer Events dialog box.
- Start/Stop Function Settings
Displays a dialog box where you can configure the emulator to execute specific routines of your application immediately before the execution starts and/or after it halts, see Start/Stop Function Settings dialog box.
- Data Sample
Opens a window where you can view the result of the data sampling, see Data Sample window.
- Sampled Graphs
Opens a window which gives a graphical view of various kinds of sampled information, see Sampled Graphs window.
- Trace
Opens a window which displays the collected trace data, see Trace window.
- Function Trace
Opens a window which displays the trace data for function calls and function returns, see Function Trace window.
- Event Log
Opens a window where you can configure the collection of Smart Analog data (event logging); see Event Log window.
- Event Summary
Opens a window where you can view the collected Smart Analog data; see Event Log Summary window.
- Power Log Setup
Opens a window where you can configure the power measurement; see Power Log Setup window.
- Power Log
Opens a window that displays collected power values; see Power Log window.
- Timeline
Opens a window which gives a graphical view of various kinds of information on a timeline, see The application timeline.
- Data Flash Memory
Displays the Data Flash Memory window, see Data Flash Memory window.
- Breakpoint Usage
Displays a window which lists all active breakpoints, see Breakpoint Usage window.