Trace window
What do you want to do?
Learn about:
Learn how to:
Get reference information about the Trace window, see below the line.

The Trace window is available from the C-SPY driver menu.
This window displays the collected trace data.
Note
There are three different trace windows—ETM Trace, ITM Trace, and just Trace for the C-SPY simulator. The windows look slightly different.
The contents of the Tracewindow depend on the C-SPY driver you are using and the trace support of your debug probe.
Trace toolbar
The toolbar in the Trace window contains:
- Enable/Disable

Enables and disables collecting and viewing trace data in this window.
- Clear trace data

Clears the trace buffer. Both the Trace window and the Function Trace window are cleared.
- Toggle source

Toggles the Trace column between showing only disassembly or disassembly together with the corresponding source code.
- Browse

Toggles browse mode on or off for a selected item in the Trace window, see Browsing through trace data.
- Find

Displays a dialog box where you can perform a search, see Find in Trace dialog box.
- Save

In the ETM Trace and ITM Trace windows, this button displays the Trace Save dialog box, see Trace Save dialog box.
In the C-SPY I-jet driver and in the C-SPY simulator, this button displays a standard Save As dialog box where you can save the collected trace data to a text file, with tab-separated columns.
- Edit Settings

In the C-SPY simulator, this button is not enabled.
In the ETM Trace window this button displays the ETM Trace Settings dialog box, see ETM Trace Settings dialog box.
In the ITM Trace window this button displays the ITM Trace Window Settings dialog box, see ITM Trace Window Settings dialog box.
- Progress bar
When a large amount of trace data has been collected, there might be a delay before all of it has been processed and can be displayed. The progress bar reflects that processing.
Display area (in the C-SPY simulator)
This area displays a collected sequence of executed machine instructions. In addition, the window can display trace data.
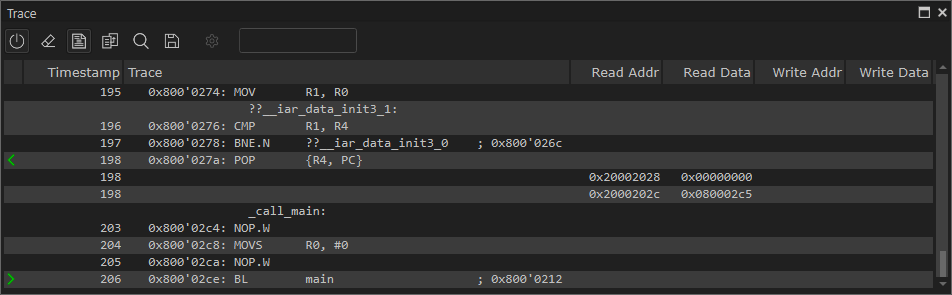
This area contains these columns for the C-SPY simulator:
The leftmost column contains identifying icons to simplify navigation within the buffer:

The yellow diamond indicates the trace execution point, marking when target execution has started.

The right green arrow indicates a call instruction.

The left green arrow indicates a return instruction.

The dark green bookmark indicates a navigation bookmark.

The red arrow indicates an interrupt.

The violet bar indicates the results of a search.
- Timestamp
The number of cycles elapsed to this point.
- Trace
The collected sequence of executed machine instructions. Optionally, the corresponding source code can also be displayed.
- Read Addr, Read Data, Write Addr, Write Data
These columns show reads and writes to memory.
A red-colored row indicates that the previous row and the red row are not consecutive. This means that there is a gap in the collected trace data, for example because trace data has been lost due to an overflow.
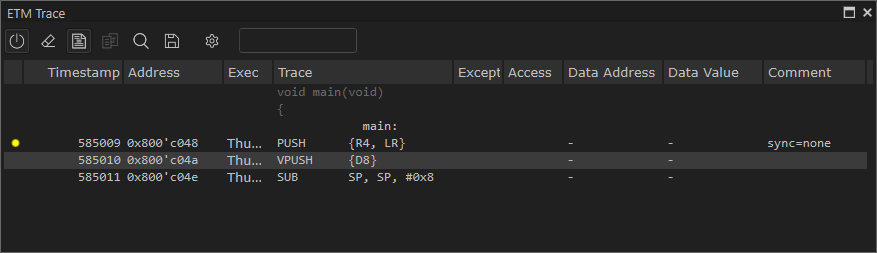
Display area (for ETM trace in the C-SPY hardware debugger drivers)
This area displays a collected sequence of executed machine instructions and other trace data.
Data trace is only available for the C-SPY I-jet driver or CMSIS-DAP driver, when using Arm7/Arm9/Arm11-based devices with ETM data trace.
This area contains these columns, depending on the C-SPY driver, the target device, and the probe you are using..
The leftmost column contains identifying icons to simplify navigation within the buffer:
The yellow diamond indicates the trace execution point, marking when target execution has started.
The right green arrow indicates a call instruction.
The left green arrow indicates a return instruction.
The dark green bookmark indicates a navigation bookmark.
The red arrow indicates an interrupt.
The violet bar indicates the results of a search.
- Timestamp
The internal I-jet Trace timestamp.
- Index
A number that corresponds to each packet. Examples of packets are instructions, synchronization points, and exception markers.
- Address
The address of the instruction associated with the trace frame.
- Opcode
The operation code of the instruction associated with the trace frame. After the hexadecimal value, extra information can be displayed:
x2— if two instructions were executedC— if the instruction was read from the I-Cache
- Exec
The execution mode—
Arm,Thumb, orNoExec.
- Trace
The collected sequence of executed machine instructions. Optionally, the corresponding source code can also be displayed.
- Except
The type of exception, when it occurs.
- Access
The access type of the instruction associated with the trace frame.
DMAstands for DMA transfer. The address and data information shows which transfer that was performed.
- Data address
The data trace address.
- Data value
The data trace value.
- Comment
Additional information.
A red-colored row indicates that the previous row and the red row are not consecutive. This means that there is a gap in the collected trace data, for example because trace data has been lost due to an overflow.
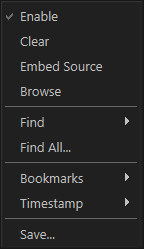
Context menu
This context menu is available:
Note
The contents of this menu are dynamic and depend on which features that your combination of software and hardware supports. However, the list of menu commands below is complete and covers all possible commands. Note that the shortcuts to the submenu commands do not use the Ctrl key.
These commands are available:
- Enable
Enables and disables collecting and viewing trace data in this window.
- Clear
Clears the trace buffer. Both the Trace window and the Function Trace window are cleared.
- Embed source
Toggles the Trace column between showing only disassembly or disassembly together with the corresponding source code.
- Browse
Toggles browse mode on or off for a selected item in the Trace window, see Browsing through trace data.
- Find>Find (F)
Displays a dialog box where you can perform a search in the Trace window, see Find in Trace dialog box. The contents of the window will scroll to display the first match.
- Find>Find Next (G)
Finds the next occurrence of the specified string.
- Find>Find Previous (Shift+G)
Finds the previous occurrence of the specified string.
- Find>Clear (Shift+F)
Removes all search highlighting in the window.
- Find All
Displays a dialog box where you can perform a search in the Trace window, see Find in Trace dialog box. The search results are displayed in the Find in Trace window—available by choosing the View>Messages command, see Find in ETM/SWO Trace window.
- Bookmarks>Toggle (+)
Adds a new navigation bookmark or removes an existing bookmark.
- Bookmarks>Goto Next (B)
Navigates to the next navigation bookmark.
- Bookmarks>Goto Previous (Shift+B)
Navigates to the closest previous navigation bookmark.
- Bookmarks>Clear All
Removes all navigation bookmarks.
- Bookmarks>location (0–9)
At the bottom of the submenu, the ten most recently defined bookmarks are listed, with a shortcut key each from 0–9.
- Timestamp>Set as Zero Point (Z)
Sets the selected row as a reference “zero” point in the collected sequence of trace data. The count of rows in the Trace window will show this row as
0and recalculate the timestamps of all other rows in relation to this timestamp.
- Timestamp>Go to Zero Point (Shift+Z)
Navigates to the reference “zero” point in the collected sequence of trace data (if you have set one).
- Timestamp>Clear Zero Point
Removes the reference “zero” point from the trace data and restores the original timestamps of all rows.
- Save
In the ETM Trace and ITM Trace windows, this button displays the Trace Save dialog box, see Trace Save dialog box.
In the C-SPY I-jet driver and in the C-SPY simulator, this button displays a standard Save As dialog box where you can save the collected trace data to a text file, with tab-separated columns.