I-jet menu
When you are using the C-SPY I-jet driver, the I-jet menu is added to the menu bar.
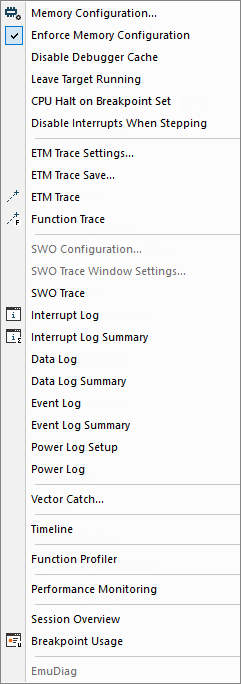
Menu commands
These commands are available on the menu:
- Memory Configuration
Displays a dialog box, see Memory Configuration dialog box for C-SPY hardware debugger drivers.
- Disable Debugger Cache
Disables memory caching and memory range checking in C-SPY.
Normally, C-SPY uses the memory range information in the Memory Configuration dialog box both to restrict access to certain parts of target memory and to cache target memory contents for improved C-SPY performance. Under certain rare circumstances, this is not appropriate, and you can choose Disable Debugger Cache to turn off the caching and memory range checking completely. All accesses from C-SPY will then result in corresponding accesses to the target system. Some of those circumstances are:
When memory is remapped at runtime and cannot be specified as a fixed set of ranges.
When the memory range setup is incorrect or incomplete.
- ETM Trace Settings
Displays a dialog box, see ETM Trace Settings dialog box (I-jet).
- ETM Trace Save
Displays a dialog box, see Trace Save dialog box.
- ETM Trace
Opens the ETM Trace window, see Trace window.
- Function Trace
Opens the Function Trace window, see Function Trace window.
- SWO Configuration
Displays a dialog box, see SWO Configuration dialog box.
This menu command is only available when the SWD/SWO interface is used.
- SWO Trace Window Settings
Displays a dialog box, see SWO Trace Window Settings dialog box.
- SWO Trace
Opens the SWO Trace window to display the collected trace data, see Trace window.
This menu command is only available when the SWD/SWO interface is used.
- Interrupt Log
Opens a window, see Interrupt Log window.
This menu command is only available when the SWD/SWO interface is used.
- Interrupt Log Summary
Opens a window, see Interrupt Log Summary window.
This menu command is only available when the SWD/SWO interface is used.
- Data Log
Opens a window, see Data Log window.
This menu command is only available when the SWD/SWO interface is used.
- Data Log Summary
Opens a window, see Data Log Summary window.
This menu command is only available when the SWD/SWO interface is used.
- Event Log
Opens a window, see Event Log window.
- Event Log Summary
Opens a window, see Event Log Summary window.
- Power Log Setup
Opens a window, see Power Log Setup window.
- Power Log
Opens a window, see Power Log window.
- Vector Catch
Displays a dialog box for setting a breakpoint directly on a vector in the interrupt vector table, see Vector Catch dialog box. Note that this command is not available for all Arm cores.
- Timeline
Opens a window, see Reference information on application timeline.
This menu command is only available when the SWD/SWO interface is used.
- Function Profiler
Opens a window which shows timing information for the functions, see Function Profiler window.
- Performance Monitoring
Opens a window which shows event counters or CPU clock cycles through the Performance Monitoring Unit (PMU), see Performance Monitoring window.
- Breakpoint Usage
Opens a window which lists all active breakpoints, see Breakpoint Usage window.
- EmuDiag
Starts the EmuDiag application where you can diagnose the connection between the host computer, the probe, and the board.